Ian Woodward's Investing Blog
Stock Market: A Review of Past and Present Flash Crashes
November 2nd, 2015I’m back! I took a long rest from posting any Blog Notes after the passing of my dear Wife of 60 Years, and I thank you for your condolences and encouraging notes.
I felt this first note on my return should bring you up to date on the events relating to the scenario for a Flash Crash going back to 2010 and coming forward to the most recent one in 2015:

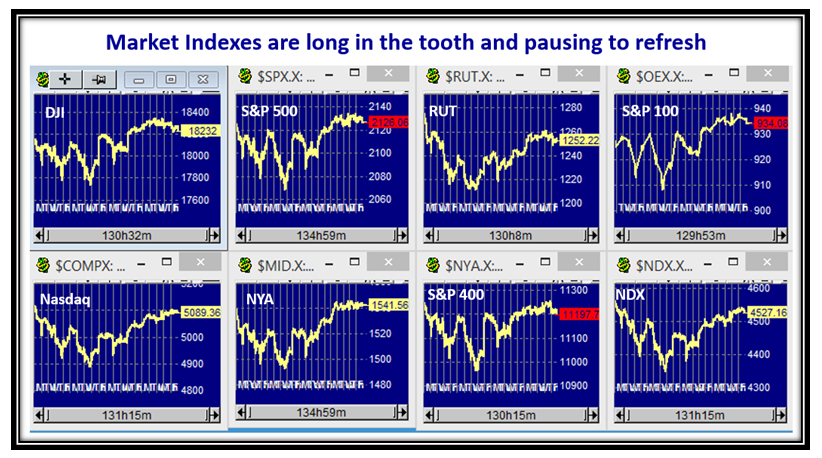
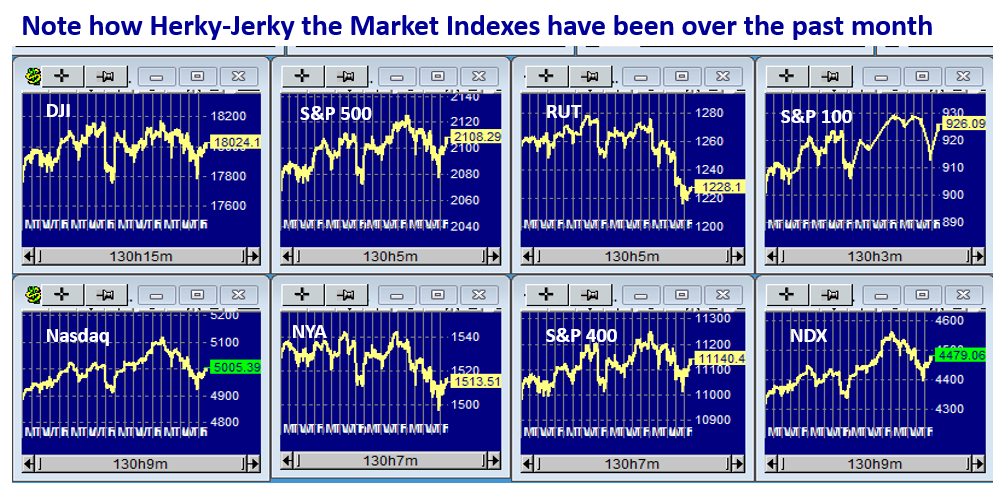
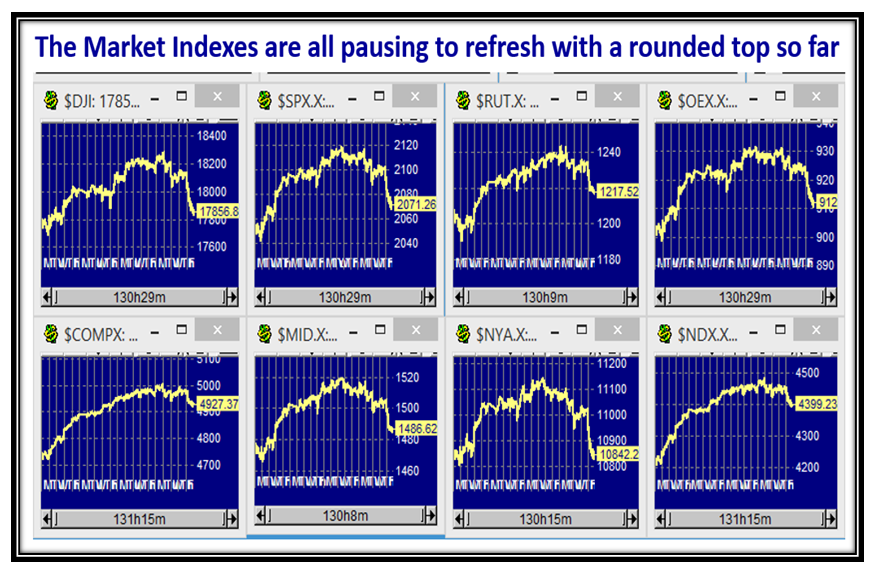
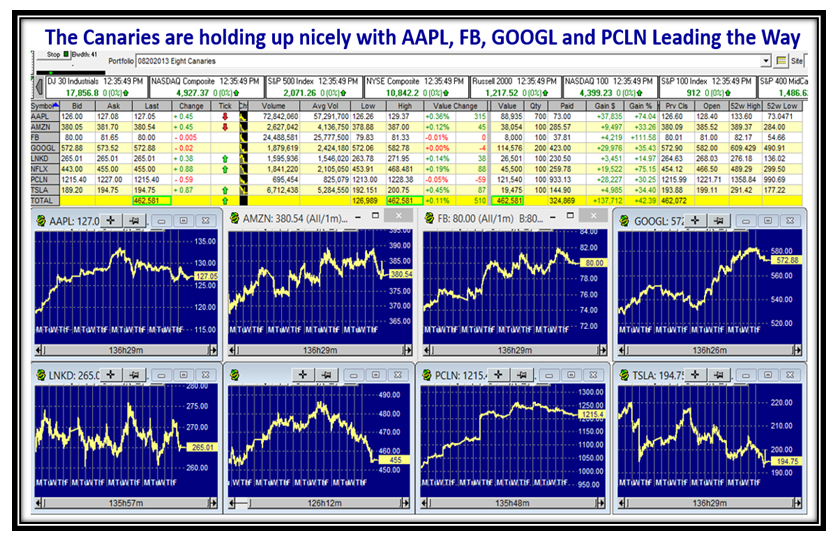
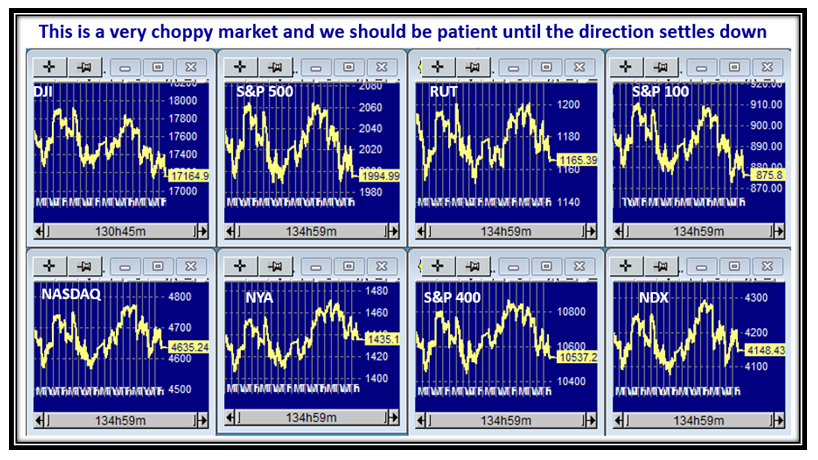
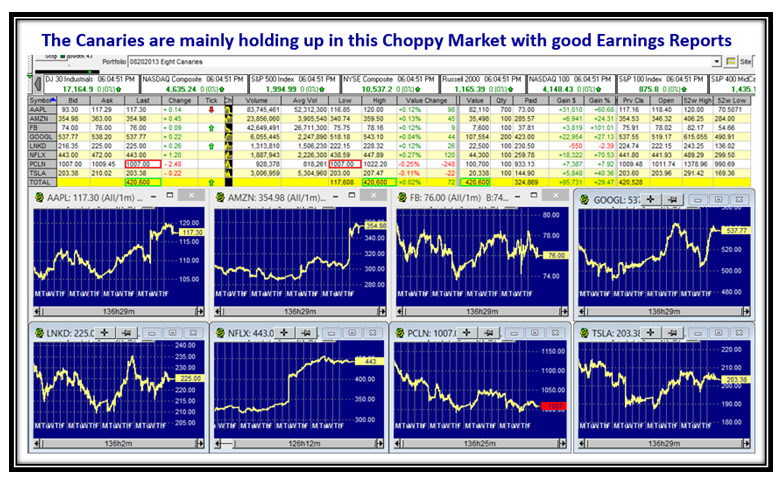
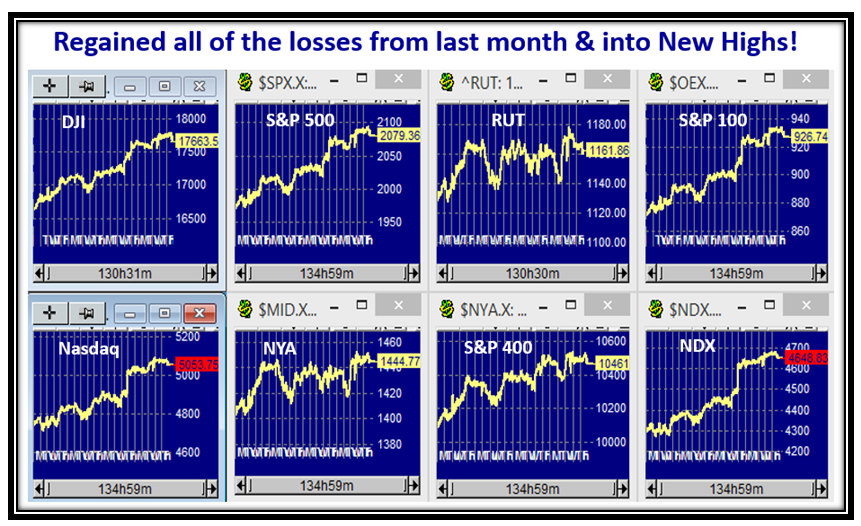
Before I discuss the Flash Crash scenario, let’s look at the Market Indexes which have all risen from the lows of 20 days ago to the new highs shown on this Rally.
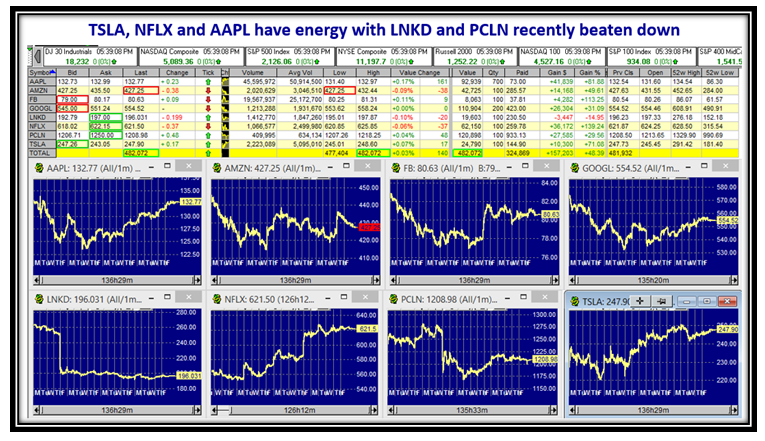
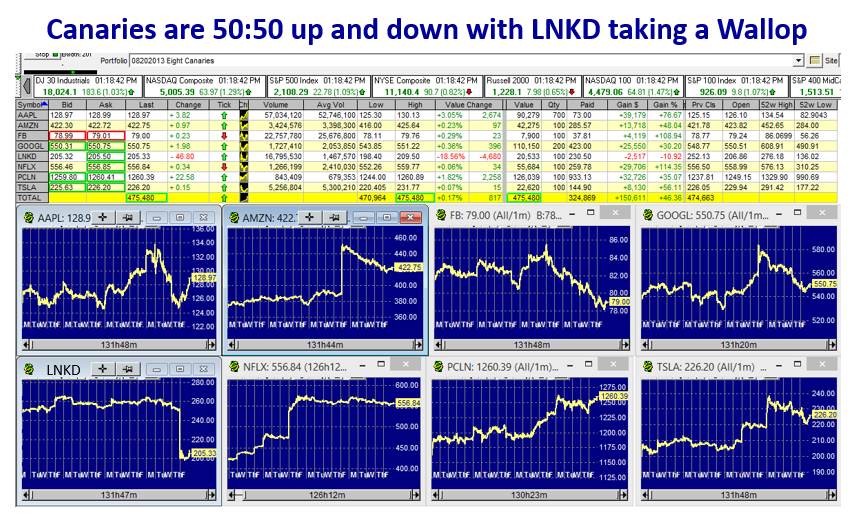
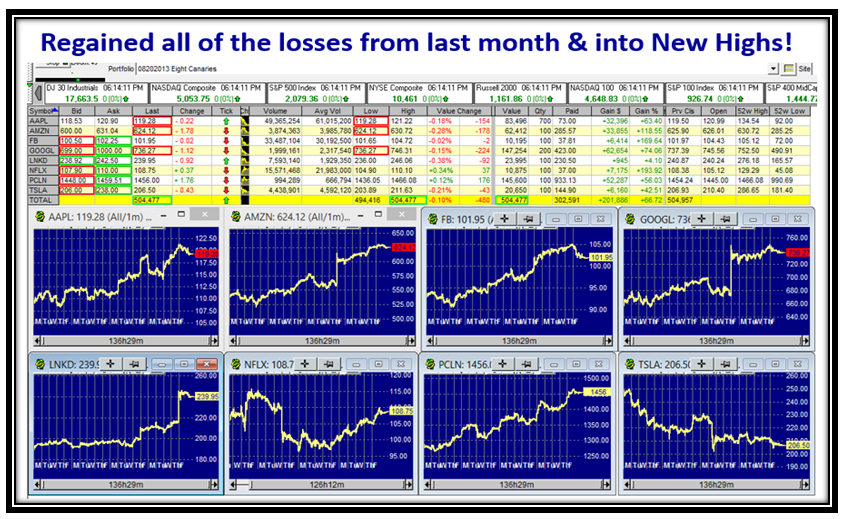
Likewise, although the Canaries had a pullback on Friday, they have also shown strength except for TSLA.
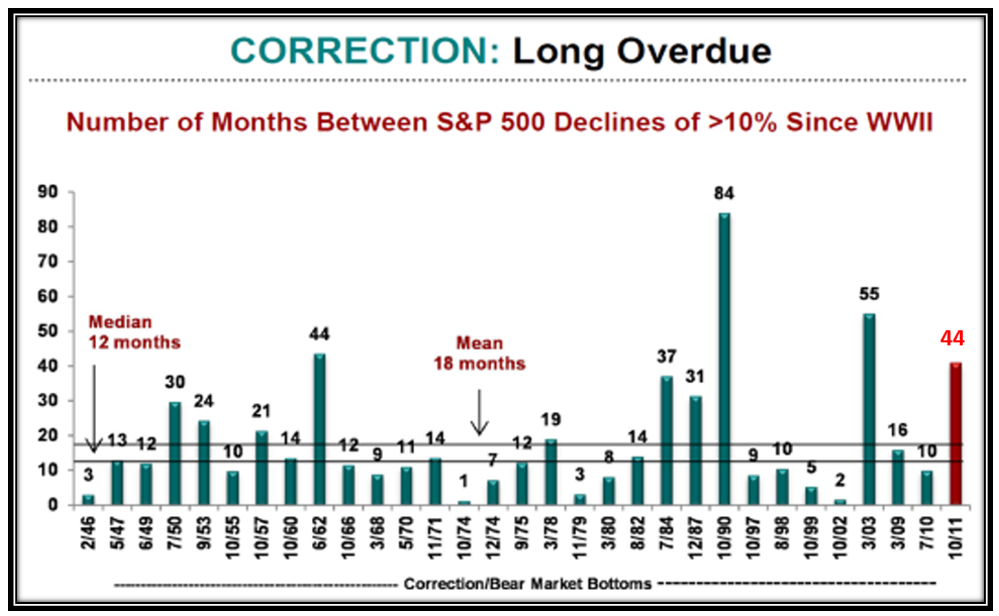
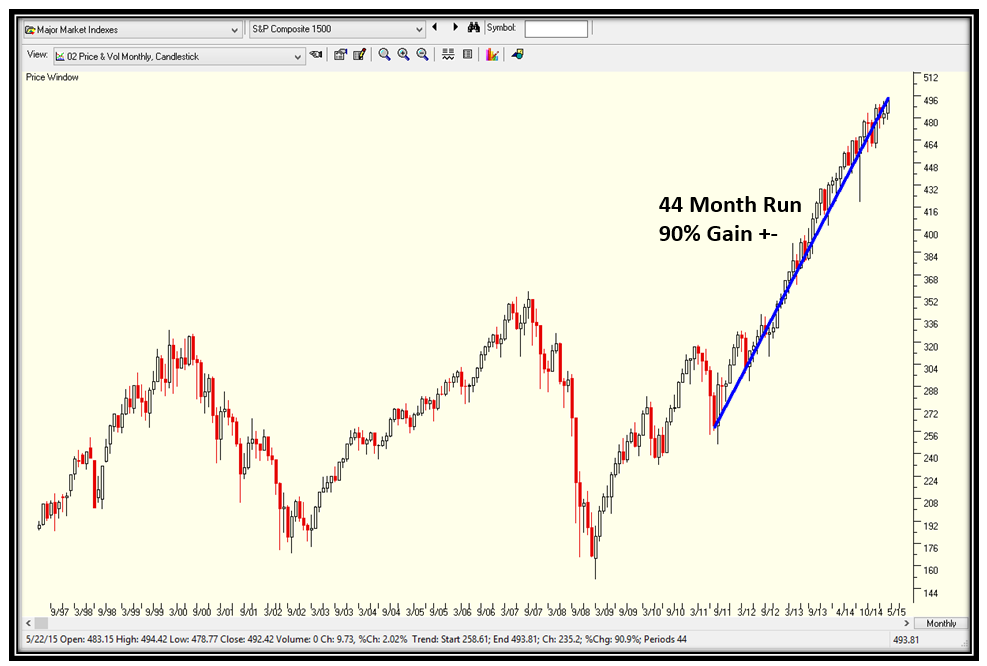
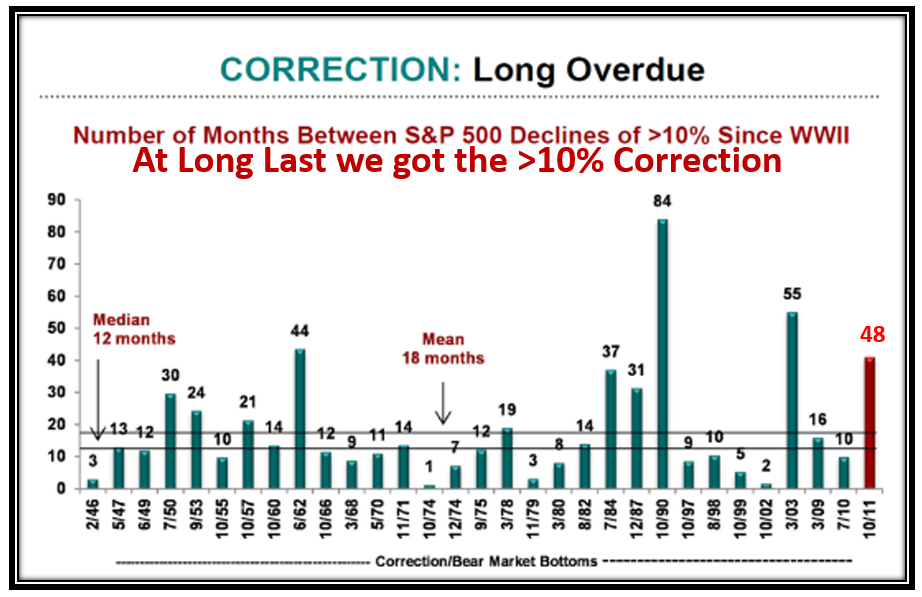
Back last August we had gone 47 Months in a row without a 10% Correction and then on August 24 & 25 we had the Flash Crash of 2015 which we will discuss below.
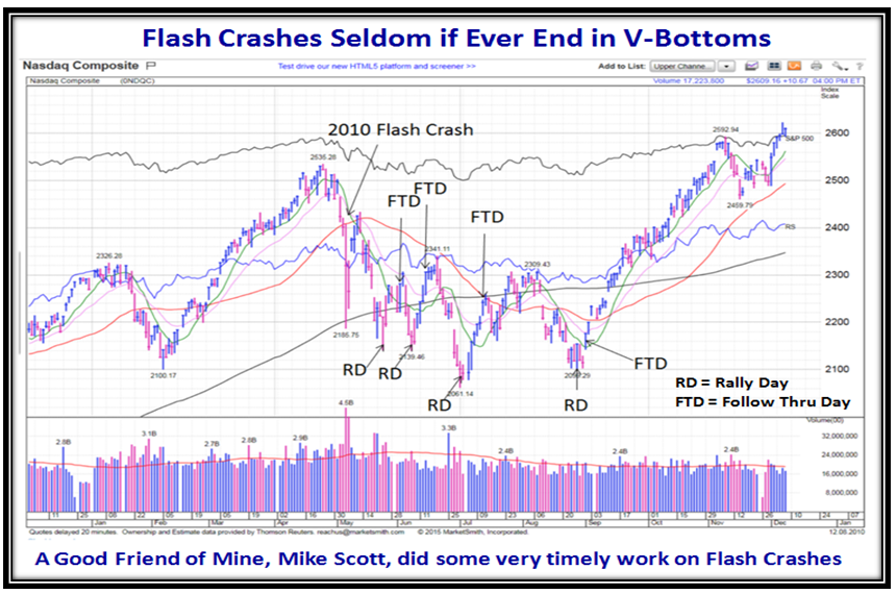
My good friend Mike Scott reminded us of the similarity of the current drop in the market to that of the original Flash Crash in 2010, showing Rally and Follow Through Days, and indicated that it took of the order of 4 Months before we were into a new Rally. This set the Benchmark for what to look for as we progressed through the current events in 2015.
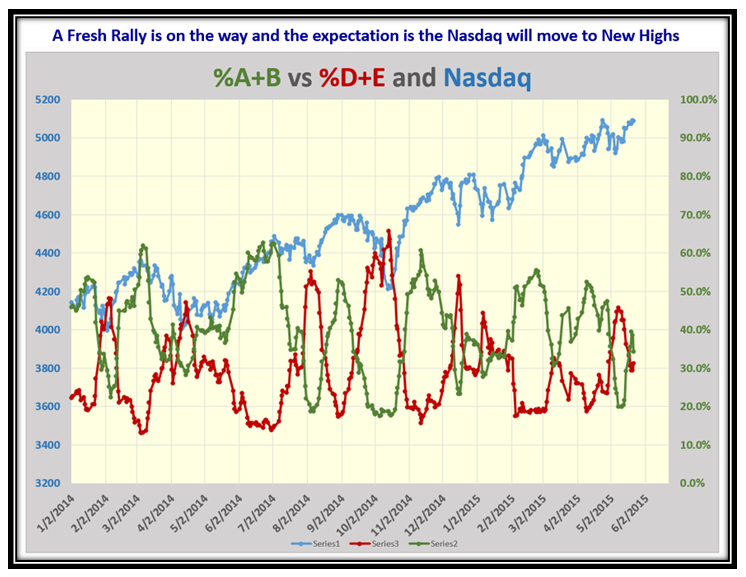
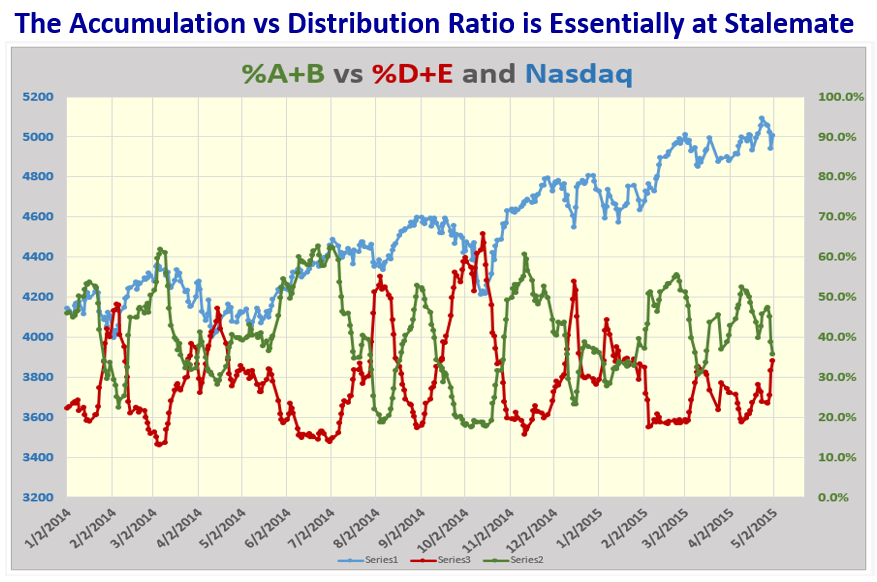
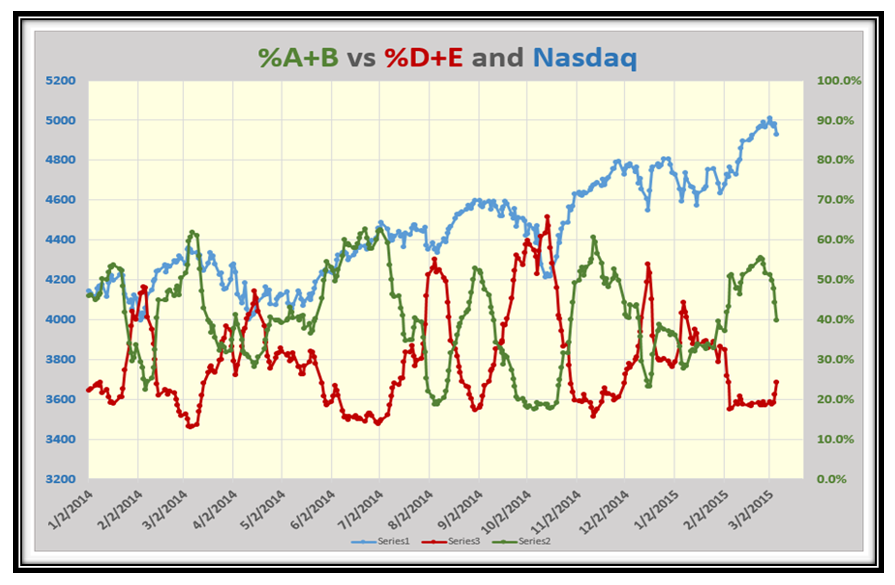
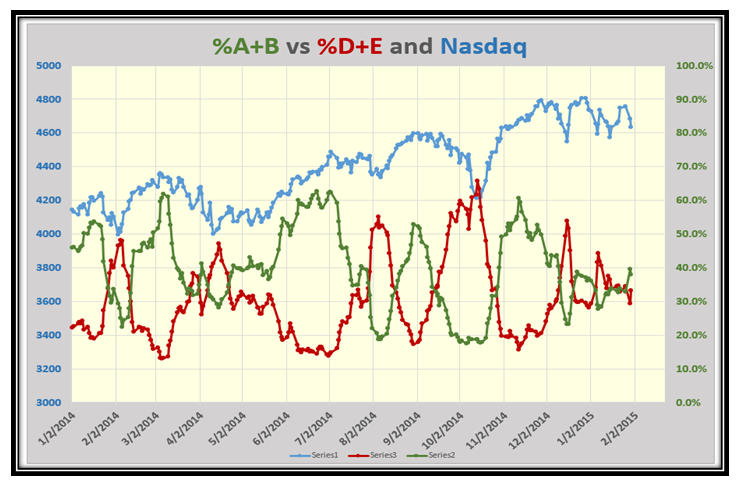
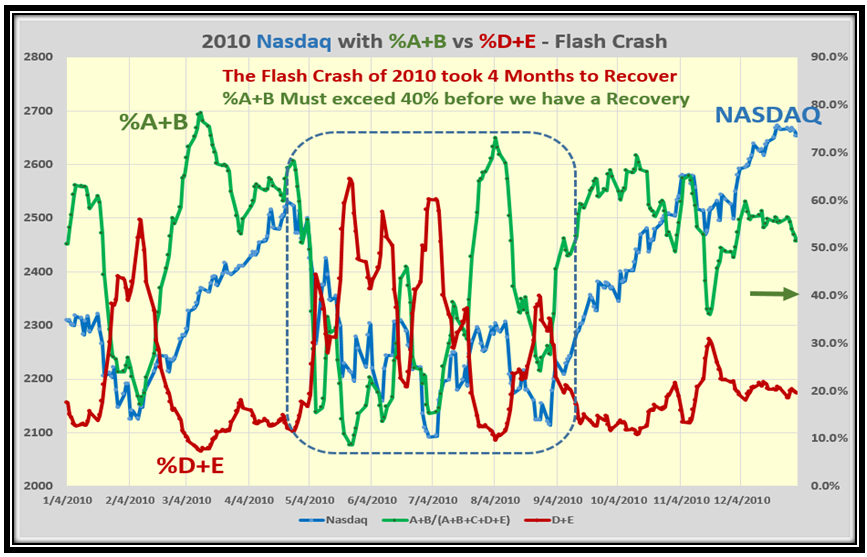
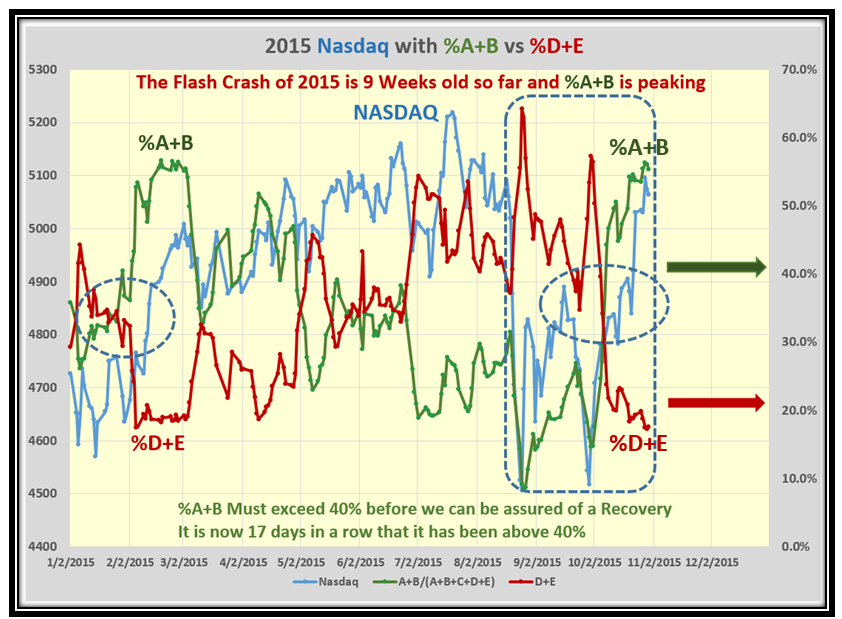
This led me to watch the % of Advancing Stocks (%A+B) to those that were Declining (%D+E) as this also gives us clues that confirm the strength or weakness of the Rallies as they occur. One clue was that %A+B must remain above 40% for the NASDAQ to show signs of recovery, while %D+E must stay below 20%. The earliest point in time would be when the two cross which is at 33%, so we again achieved some worthwhile stakes in the ground for rallies:
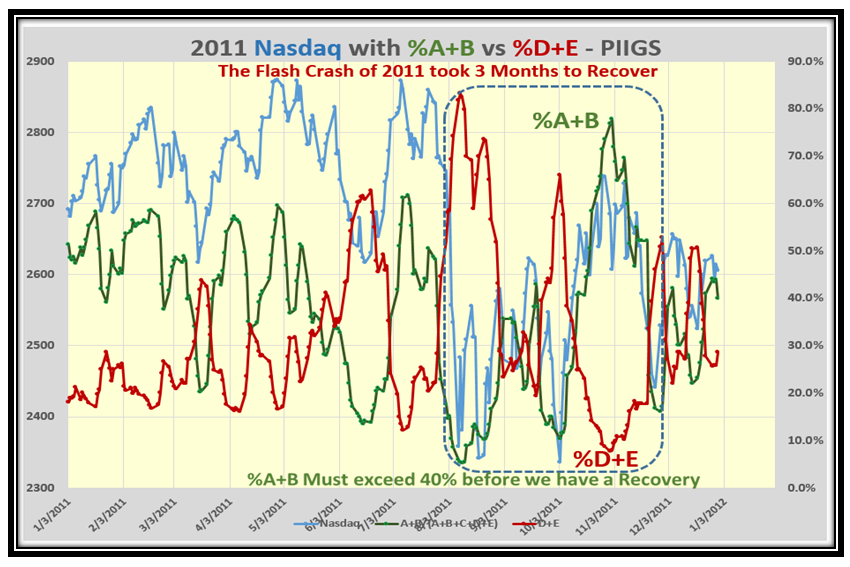
To take this idea a step further I was quick to look at the Debt Crisis for the PIIGS (Portugal, Italy, Ireland, Greece and Spain) in 2011 and again we see a similar pattern with a minimum of three months before the Market recovered:
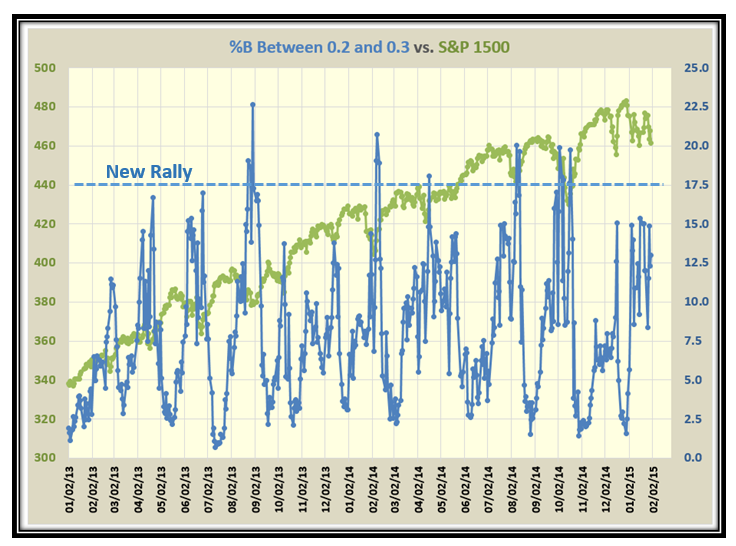
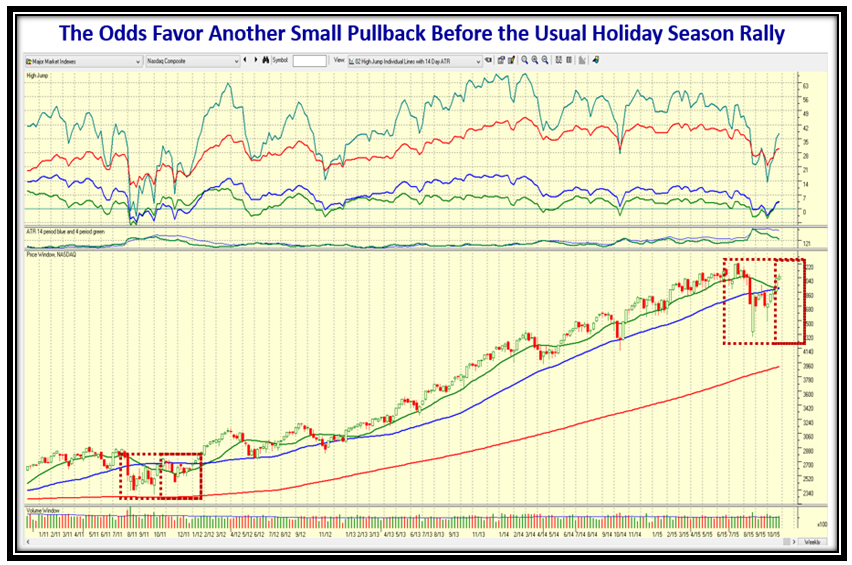
…And now advancing quickly to 2015 we are 9 weeks into recovery so far and should expect a pullback as %A+B is over 55% and is showing signs of being extended. Please note that the Rally is now 17 days from the completion of a double bottom, so some form of retrenchment is on the cards before we move up again for the usual Thanksgiving and Christmas Rallies.
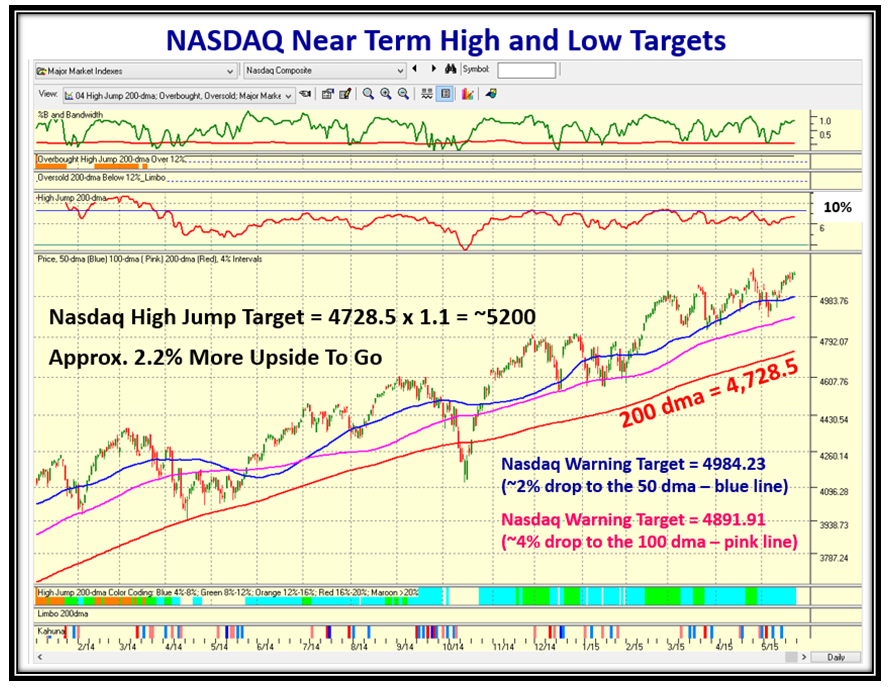
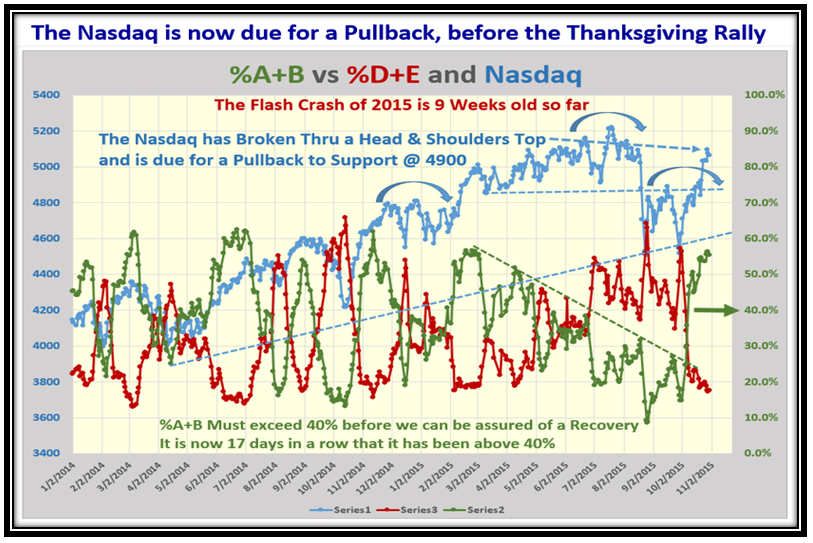
This next chart shows that the NASDAQ has broken thru the Head and Shoulders Top, so we shall see if it has the energy to continue to new highs or will likely retrench before moving up again:
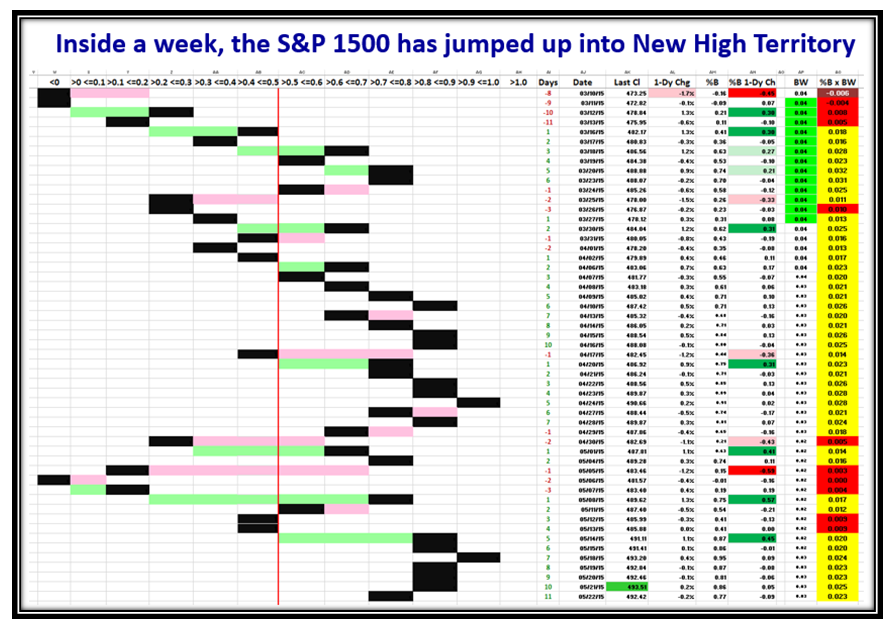
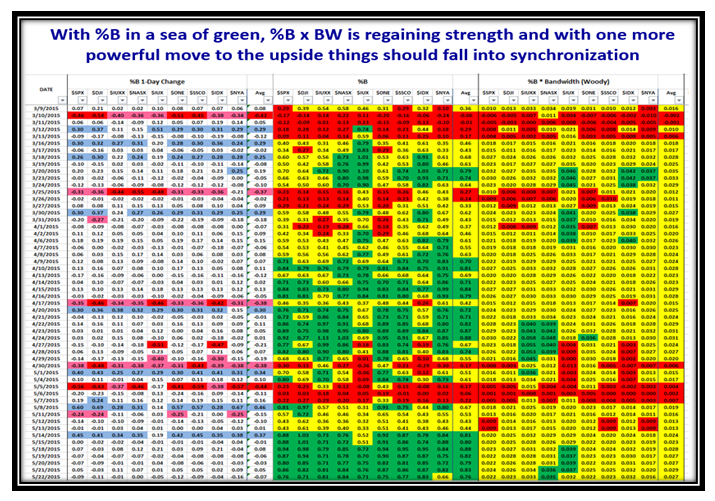
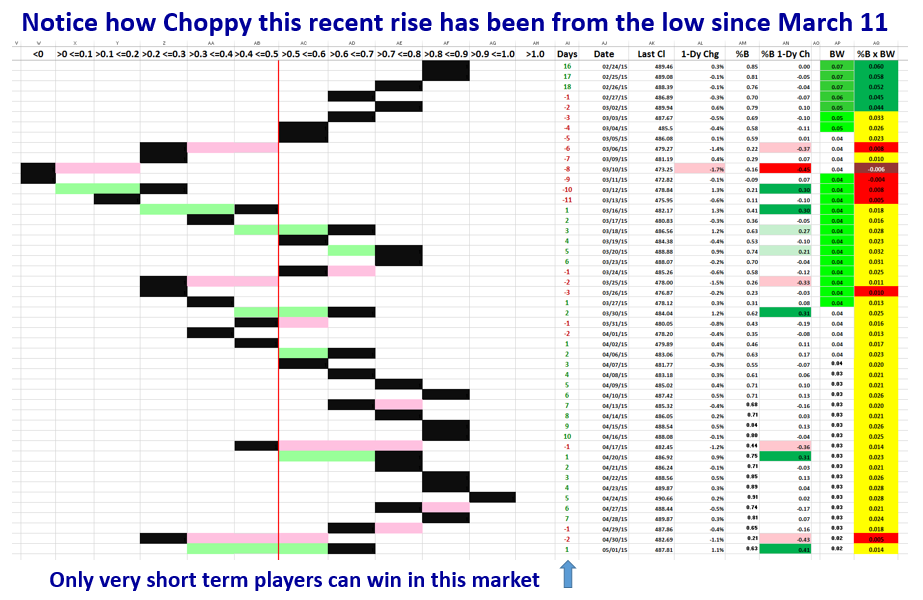
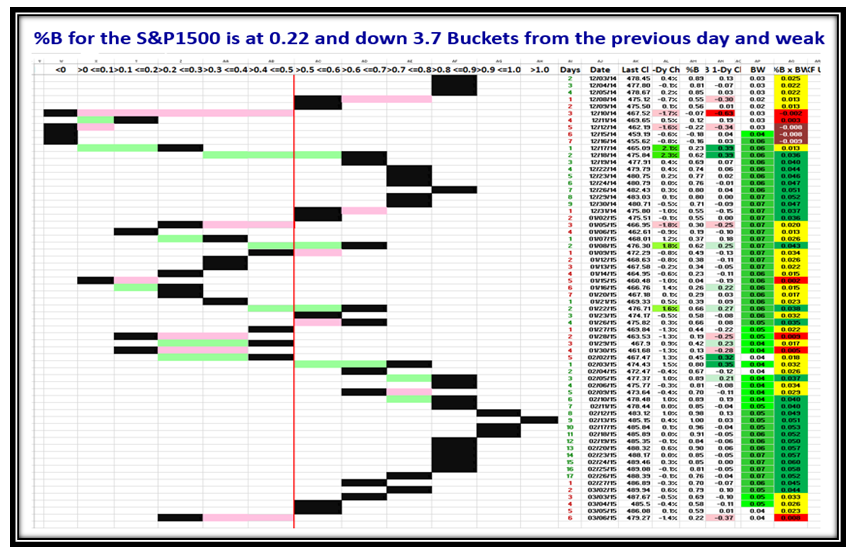
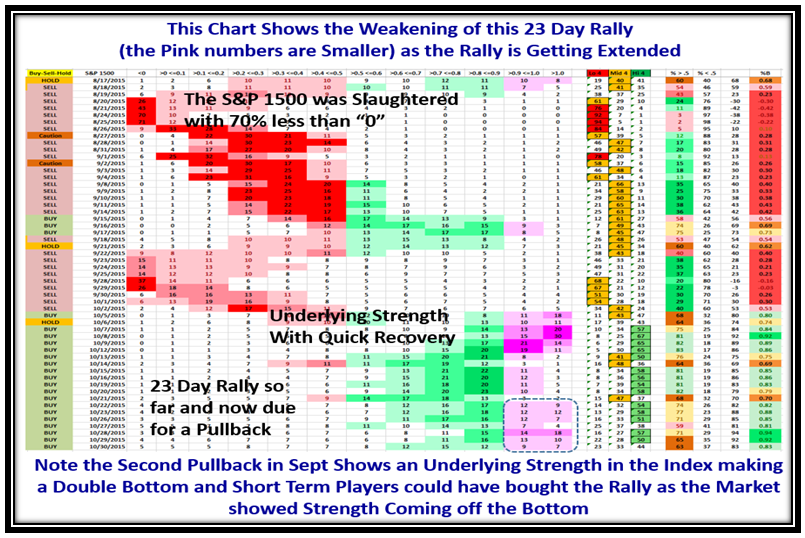
This next chart of the various numbers in %B Slices confirm what we see in the %A+B vs. %D+E in that the Original Flash Crash on August 24 & 25 shows that 70% of the S&P 1500 was below the Lower Bollinger Band (<0), so the Market took a bad fall! After recovering within 12 days, the second leg down was not as violent so that the next recovery after the W bottom was very fast and the Market was Overbought within a week! At this stage we are 23 Days into the rally so are due for a pullback as the overbought slices are not showing the same strength as shown by the dotted frame.
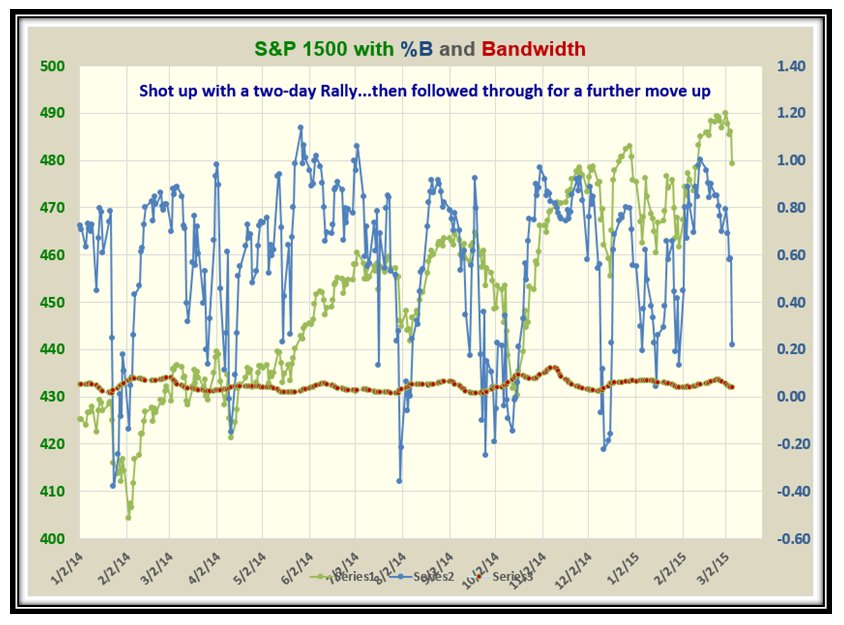
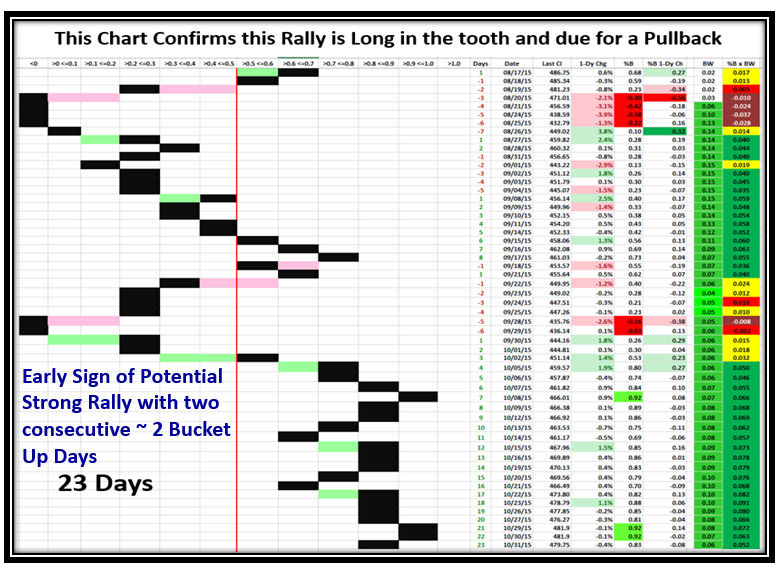
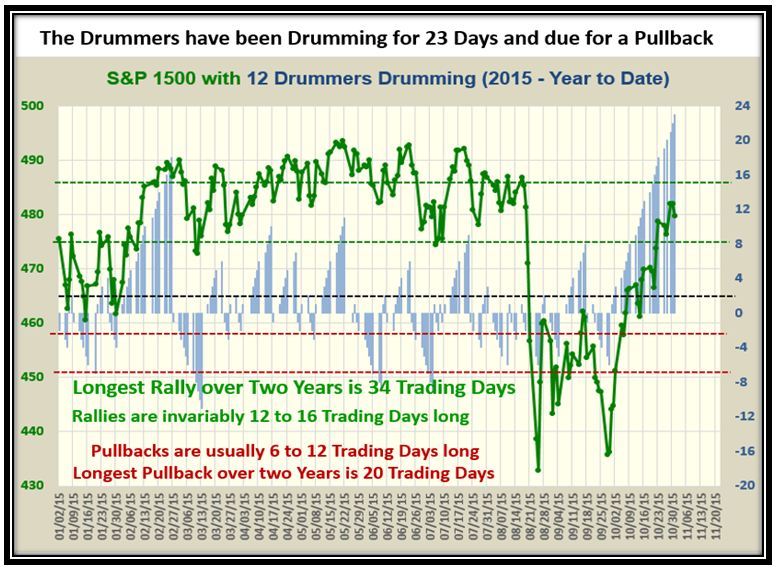
This chart again confirms that the rally with two buckets up on two consecutive days, but now we have 23 days up for the rally so it is getting long in the tooth. However, as I write this piece on Monday morning the Market is up strong yet again so there are no signs of a pullback yet.
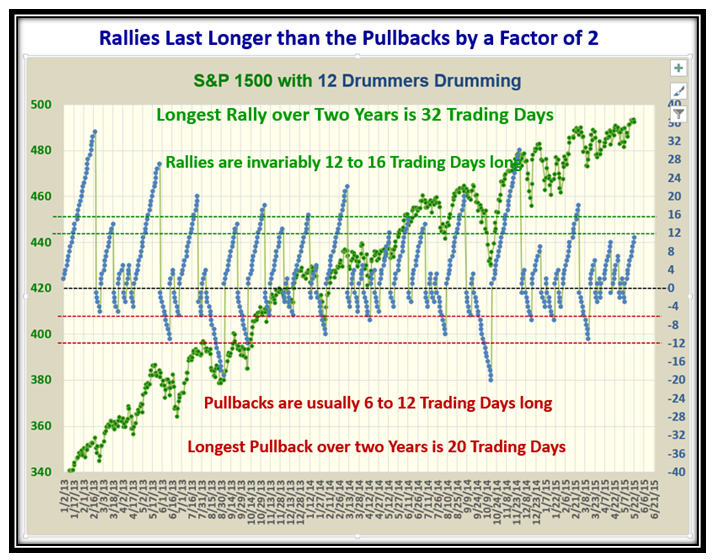
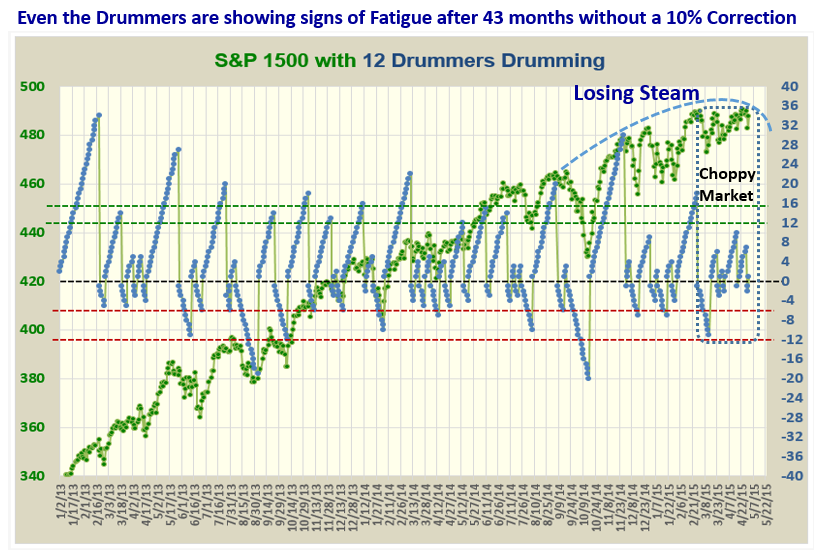
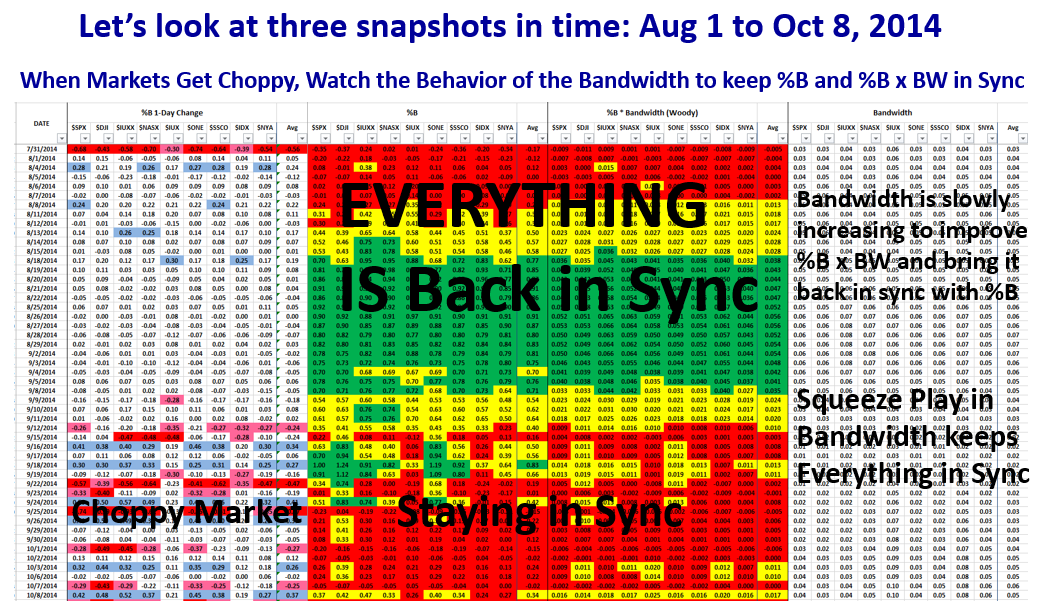
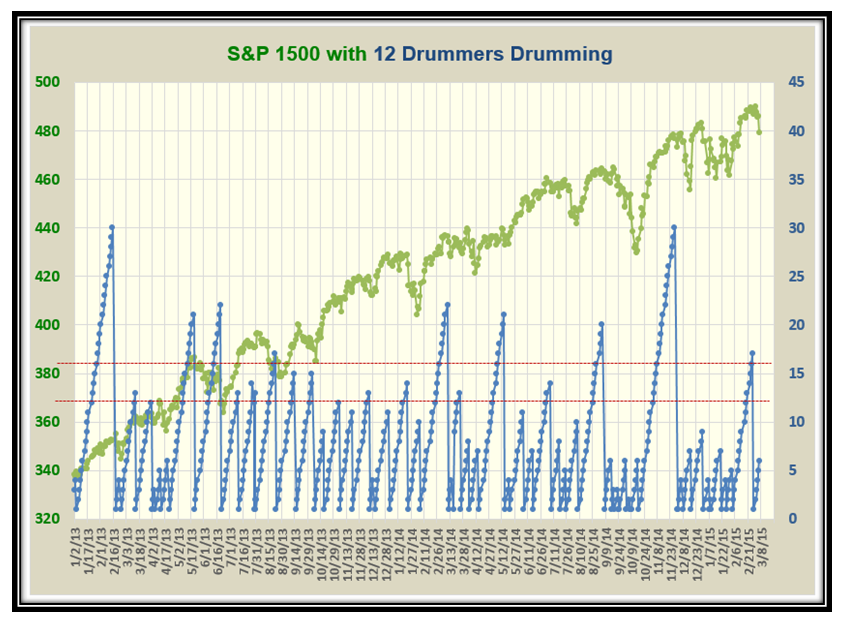
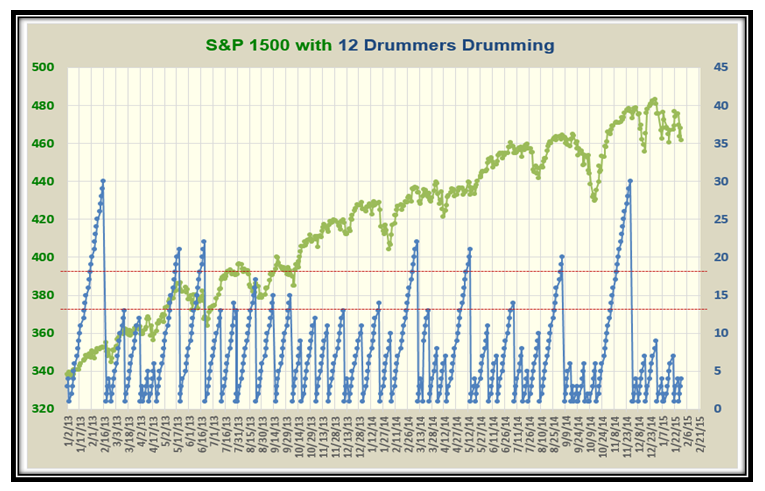
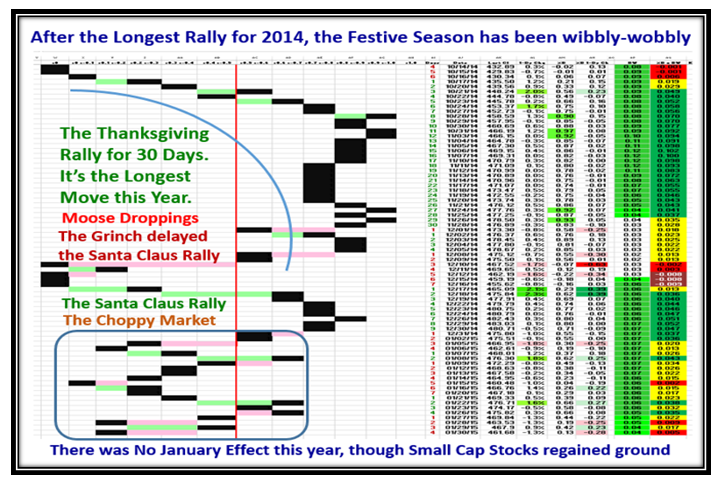
This chart of the Drummers Drumming shows that it is the longest consecutive run we have had this year where the period before the Flash Crash was so choppy and showing a topping action, warning of the possibility of a big pullback.
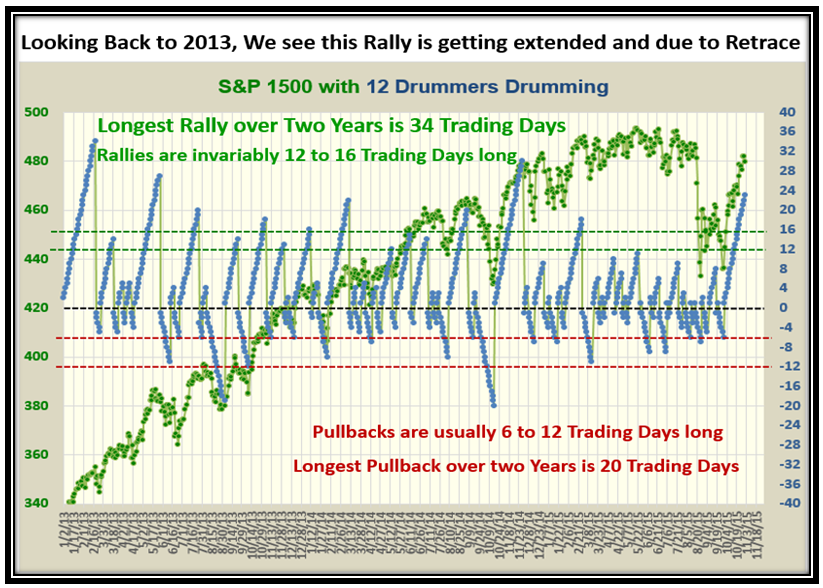
This shows more of the same but gives perspective of the longest rallies over three years and shows we can still head up for another 10 days or so without a breakdown:
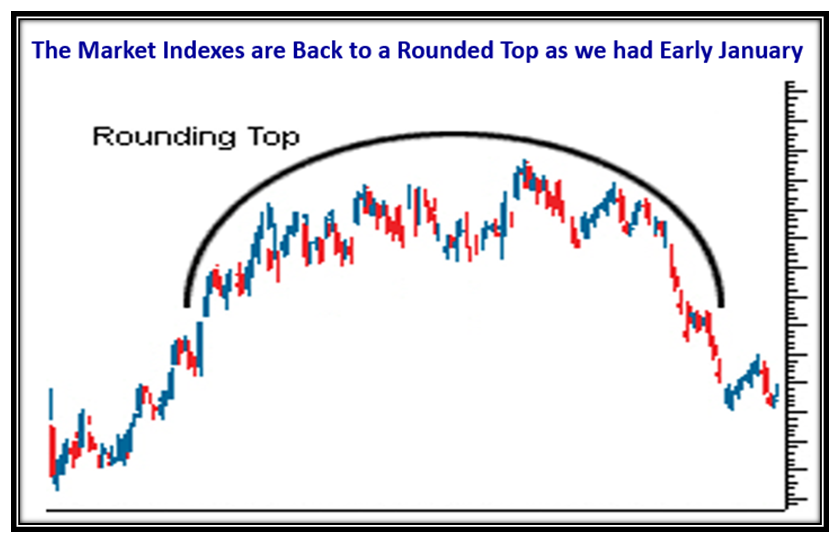
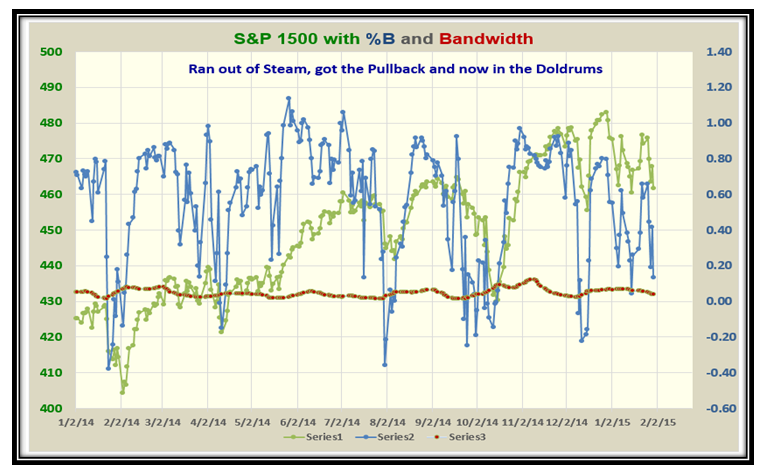
At the time of the Flash Crash, I took the formation at the bottom of this next chart and placed it on the top to show what we should expect as the weeks rolled by.
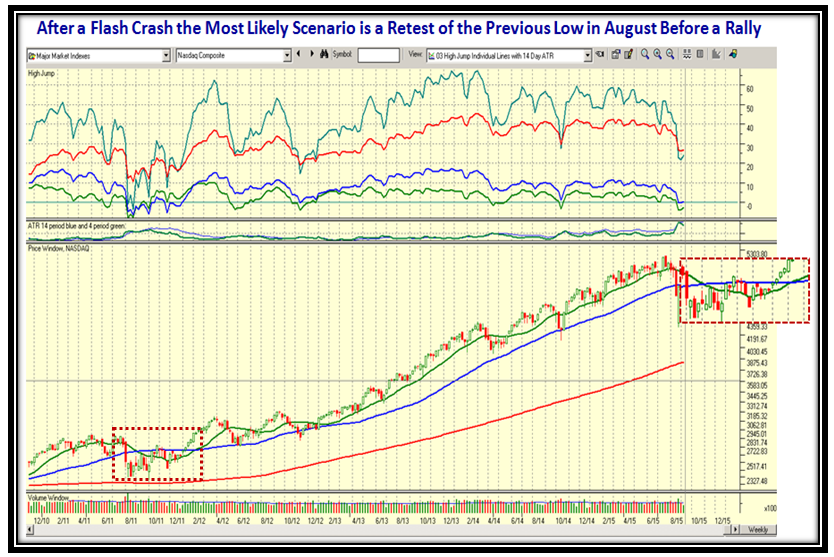
…And this picture shows an up to date picture of what has transpired since then and that we could still see a pullback before we trot off up again into the sunset! This then begs the question of what are the two possible scenarios for the Market from here.
- The Market Indexes plow through their old highs into new high territory due to the push for the Holiday season before we see a pullback, especially as August was a poor month or
- We see the pullback before Thanksgiving and then we see a bounce up with a strong rally into the new year. After all it is bonus due time and the big boys want to earn their strong bonuses going into the New Year.
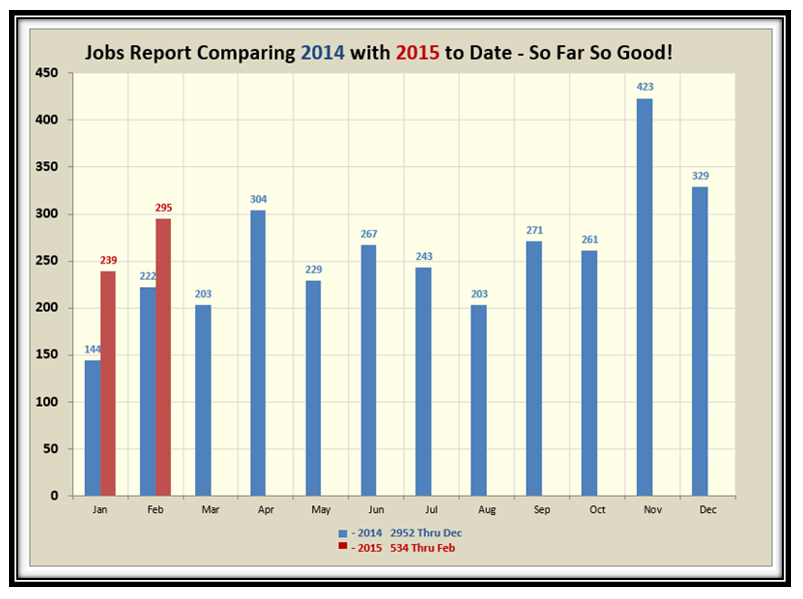
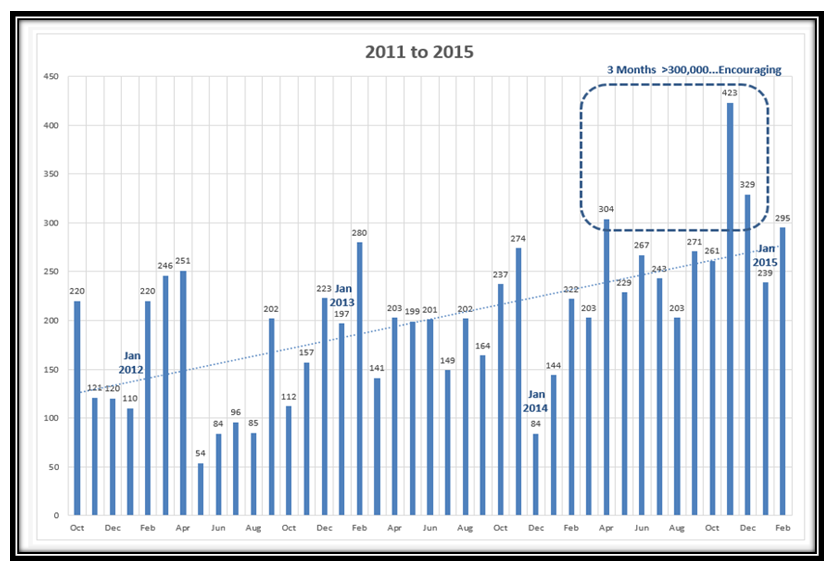
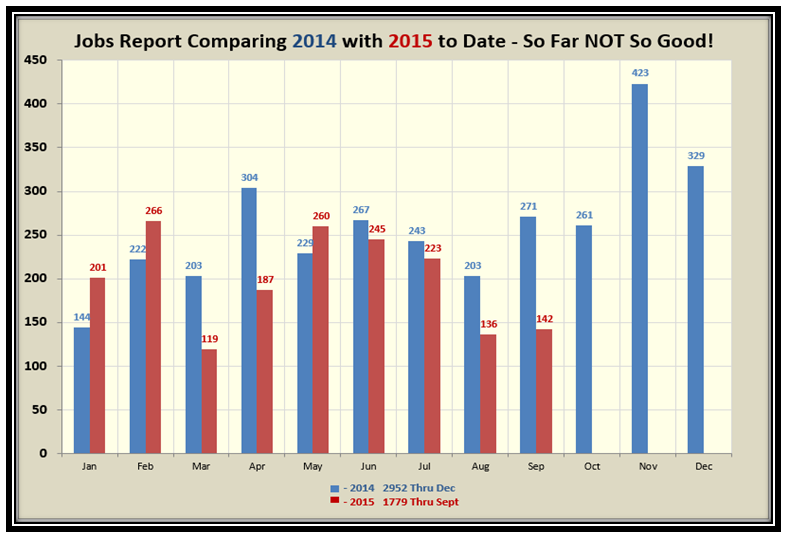
…And finally, here is the Jobs Report which is poor compared to last year. I’m sure this is why the Fed pulled back from raising interest rates in October.
This is my Thanksgiving gift to you and I hope it helps you see both sides of the Market of Fear and Greed!
Best Regards,
Ian.