Ian Woodward's Investing Blog

Archive for the ‘Uncategorized’ Category

Stock Market: Rounded Top Action for the Festive Season

Saturday, January 10th, 2015

After a long Rally for Thanksgiving, the Stock Market has been a nightmare to trade in, up down and round about!

Picture Rounded

…And to prove it, here is the action of the Major Market Indexes over the last 20 Days:

Picture Indexes

Likewise, the Canaries have been trotting around doing nothing spectacular:

Picture Canaries

The S&P 1500 %B shot up with the Thanksgiving period and then has wobbled around with a weak Rally:

Picture S&P1500

This next chart demonstrates the various phases we have suffered after the strong period prior to Thanksgiving:

Picture Pat

The Twelve Drummers Drumming chart shows the periods of up, down and sideways very well, and we see recent turmoil:

Picture Drummers

This chart shows clearly the Stalemate we are in with %A+B below %D+E stocks under Accumulation/Distribution:

Picture abcde

As I have taught you in previous recent charts, the biggest clue as to when the Market has completed correction is when the % of Stocks in Bucket 0.2 to 0.3 is >17.5%.  We are currently at ~11.0% so we are not there yet and we need to be patient…hence, the market can go in either direction starting next week:

Picture Percent B

…And, as you would expect, when we examine a higher Range of %B, such as Buckets >0.6 and <0.8, the Rally is very weak:

Picture Percent B2

Net-Net, the January Effect was delayed and essentially fizzled, so we shall see if the Small Cap stocks pick up from here.  Be patient and remember the stake in the ground at this point in time between the Bulls vs. Bears is Stalemate:

Happy New Year!

Ian.

Stock Market: Game Plan using %B Buckets!

Wednesday, July 10th, 2013

Here is a recent question from Paul R regarding the State of the Union ala Kahunas and Buckets:

Ian any thoughts about the current rally in the market as we haven’t had any Kahunas in the indexes other than the Russelll 2000 since the Eureka on June 26?

That would suggest to me we really don’t have a broad market participation.

Paul R

Hi Paul:  As my younger son Paul would say “You are a Smart Dude”!

Sometimes hard and fast numbers can mislead one, so I had to look under the covers to come up with the answer.  I dub this Bounce Play an “Under the Radar Rally”, as you will see from the chart below.  As you rightly say the RUT is the only beast that has shown Kahunas, as the others have all been slightly below the 0.24 requirement to signal a small Kahuna.  To my eyes, that’s “Close enough for Gov’t work”!

The right hand side of the chart says we do have broad market participation, since %B on Average is at 0.91 and knocking on the door of being very overbought, as it is so close to 1.0, the upper Bollinger Band. We can immediately see that the NYA is the laggard and everyone knows by now that the Small Cap RUT and S&P 600 are the leaders.

Looking ahead, if we get a ROW of Kahunas NOW ala 06/13/13, it will be a Major sign of an Exhaustion Gap to the upside, since all Market Indexes would be >1.0 and therefore OVERBOUGHT above the Upper BB.

Blind Paul

Since we are now at “Double Tops” or higher for most Market Indexes, we should expect a correction sooner than later as I described in my previous blog note , but the alternative is to see an Exhaustion Gap to the upside.

Now the Game Plan is simple, but you had me tossing and turning in bed last night trying to figure out the conundrum!

This stuff is fun!  Italy seems to be getting the hang of it as they were all over my blog note the other day!

Ian

Stock Market: Floodgates Opening, but No Panic Yet

Sunday, April 7th, 2013

As expected the poor Jobs Report on Friday took the Market down big time at the open, but there was a respectable Bounce Play from the lows.  However, it was not nearly enough to stem the tide and with the S&P 1500 losing another 2.5 Buckets to the downside on top of the 5.4 Buckets two days previously, the Bulls are hanging on with their finger nails.  This next week will tell:

Floodgates Picture

The knee jerk on Friday is obvious from the next Chart of the Market Indexes:

Floodgates Indexes

The Russell 2000 (RUT) has given up around 3% from its high and has shown its teeth with a drop of %B x BW to below Zero:

Floodgates RUT

The turbulence is evident from our next chart of the damage done to the S&P 1500 these past three days:

Floodgates Pat

I have picked up on a view which I introduced to you in my last Blog Note and hope you will use this to stay on top of the right side of the Market and to understand the shifting winds as we go into the next week using the HGSI software.  There is a lot on information at a glance with this view using the Major Market Indexes with the T1 view in Warehouse:

1.  We had 5 Indexes take a > -0.24 Hit on Friday, with the NASDAQ 100 going down over 4.25 buckets.

2.  We have two indexes, the NASDAQ and NDX, both below the lower Bollinger Band

3.  They ran for cover in the Transports and Utilities on Friday

Floodgates Indexes2

Now for a look at the top two canaries, one gasping and the other healthy…AAPL and GOOG, respectively:

Floodgates Canaries

AAPL’s performance has been worse than dismal and is down about 40% from its high.  Maybe it is finding its bottom, but sad to say with this recent performance it has given up its leadership to GOOG.  However, you must still follow it as its weight on the NASDAQ and NDX Indexes is so out of proportion compared to the rest of the stocks that its movement will influence these Indexes both ways:

Floodgates AAPL

Now, let’s look at GOOG which is behaving substantially better, with the Canary still sitting up and chirping…it is the leader now:

Floodgates GOOG

We shall see if the Floodgates open wide next week or the Bulls come charging back to produce another Fakey!!

Best Regards,

Ian

Stock Market: Indexes are in Overdrive!

Sunday, February 3rd, 2013

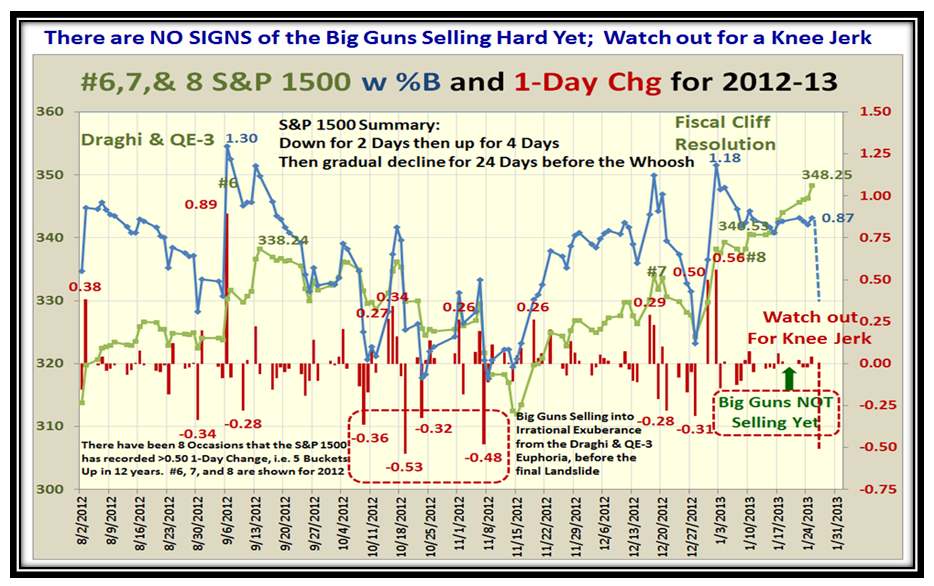
My good friend, Mike Scott used this very apt term to describe the current state of the Market, so that is my heading for today.

Overdrive Picture

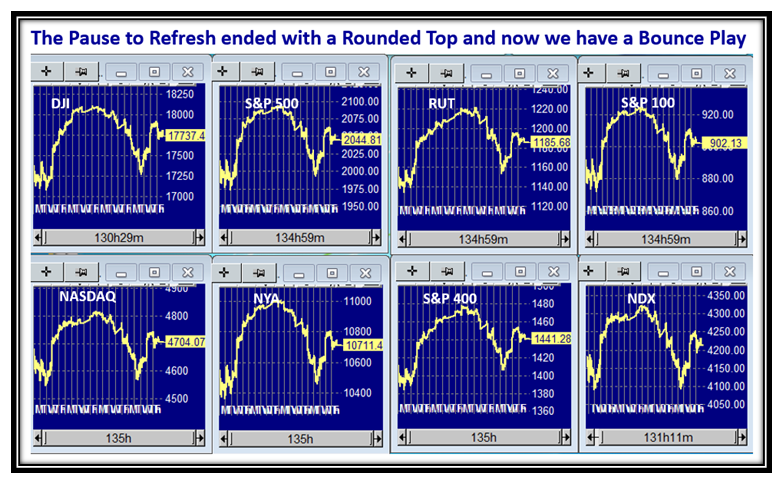
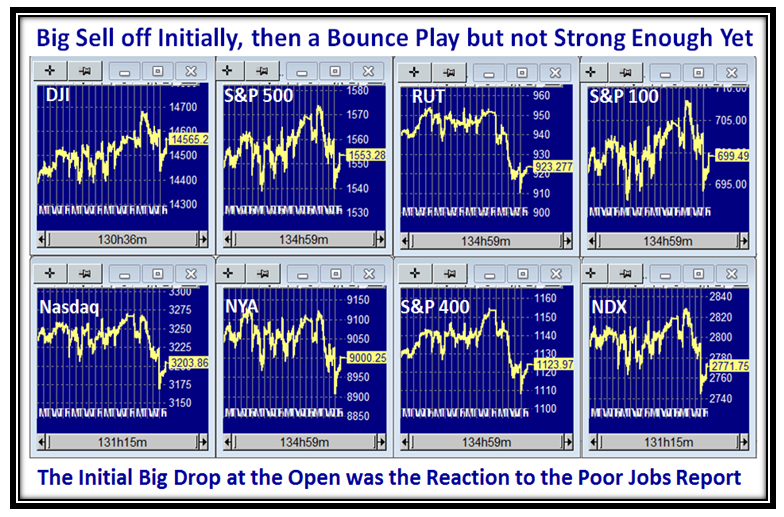
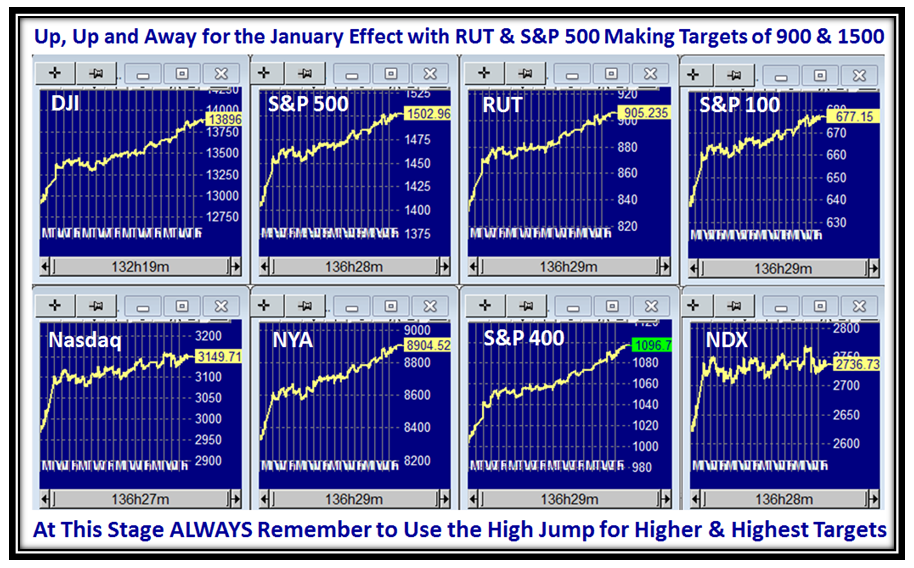
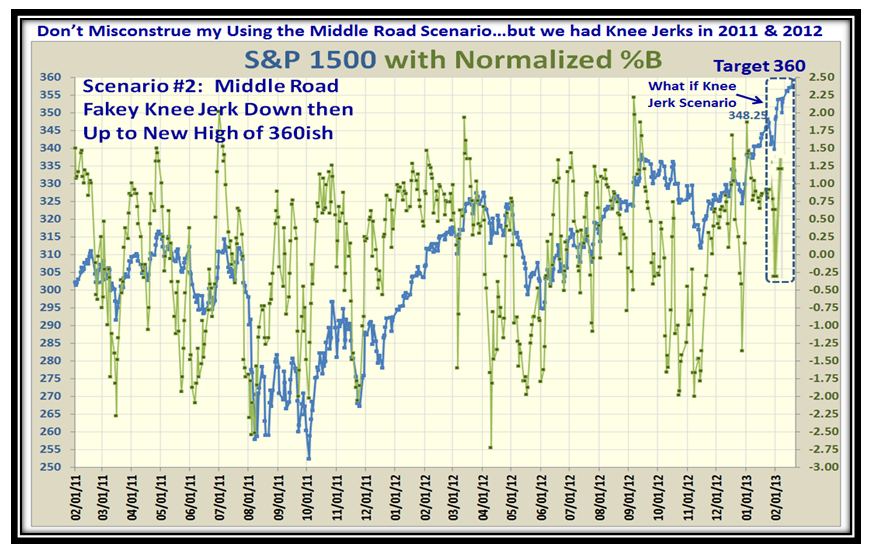
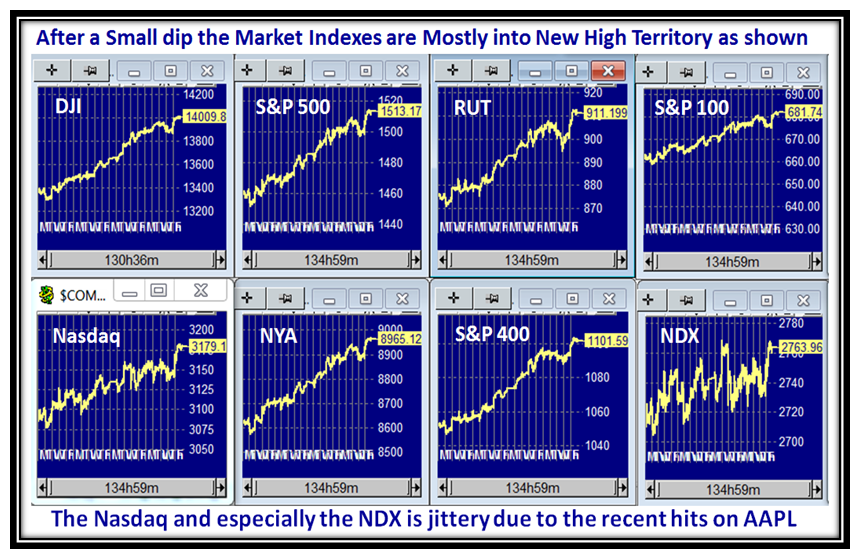
We had a whiff of the Middle Road Scenario with a very small knee jerk last week, but that was all eradicated on Friday which took the DJI into 14,000 territory and most of the Market Indexes still heading up into new Highs:

Overdrive Indexes

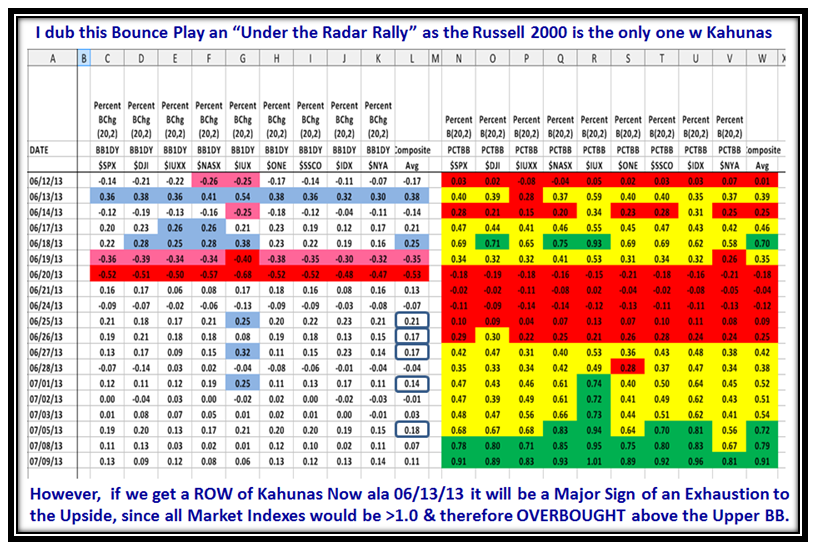
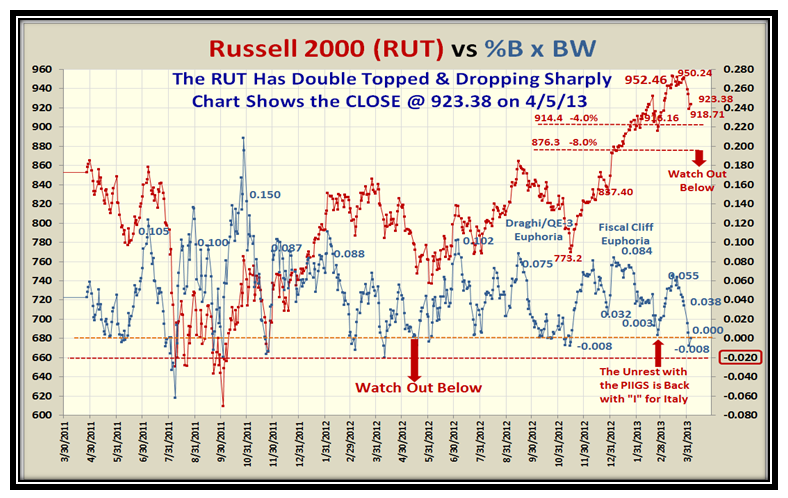
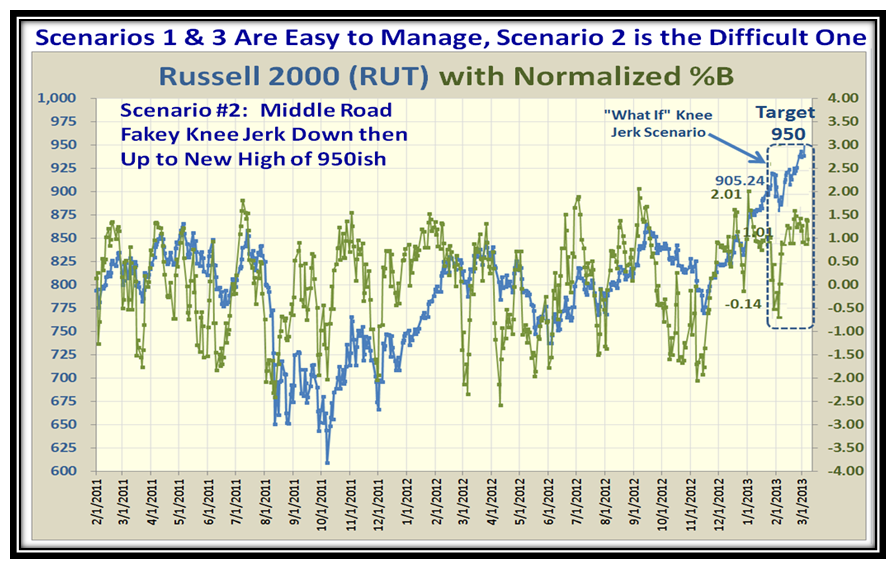
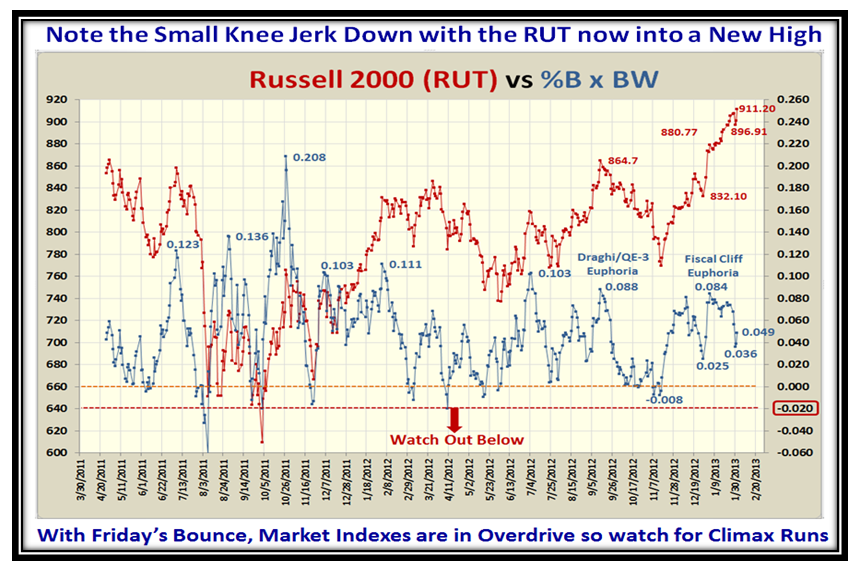
…And here is the Russell 2000 (RUT) to show that small knee jerk, followed by the powerful move on Friday, kept the cushion intact for a possible big bucket down day.  Now the Bulls have their cake and can eat it too should the Big Guns start to unload:

Overdrive RUT

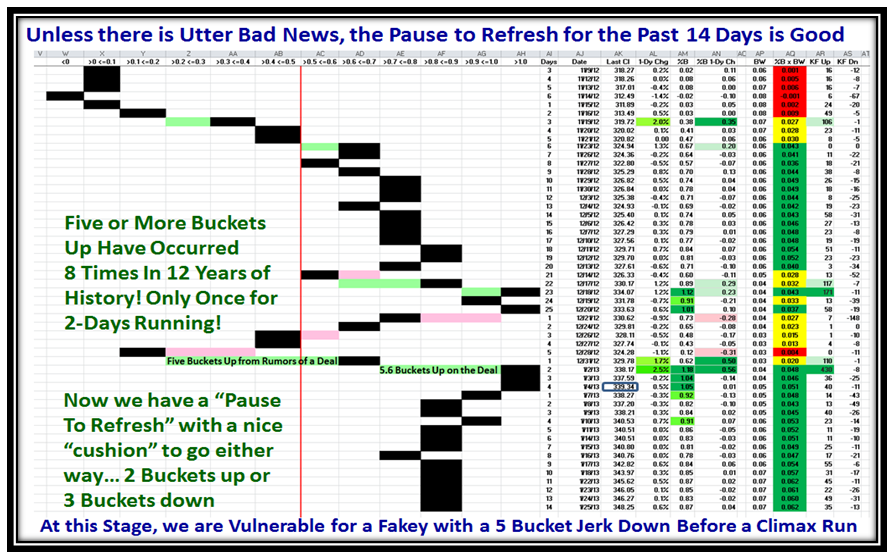
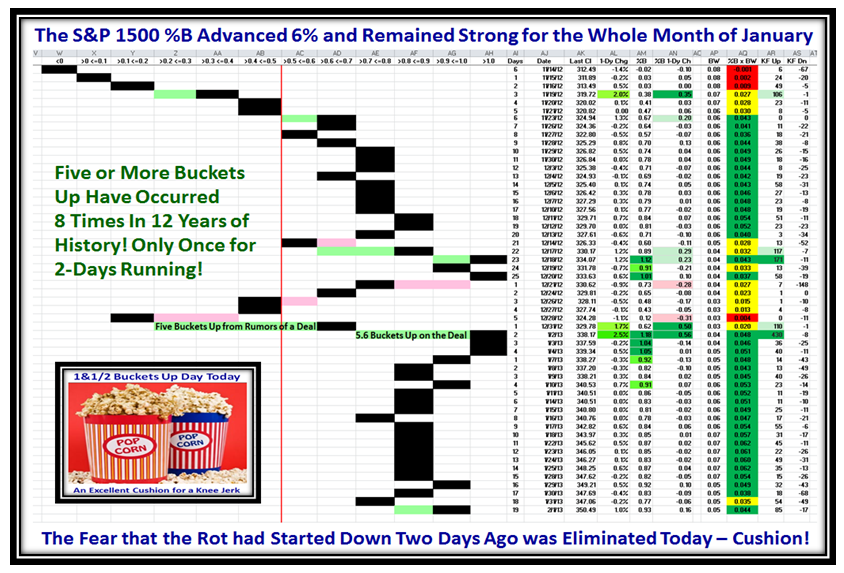
…Right on time, we got close to 2 Buckets up of pop-corn, so the previous two days downward action are negated:

Overdrive Pat2

So the beat goes on and we are now back on the High Road Scenario, where many were shaken out but we stood firm and tall:

Overdrive Scenarios

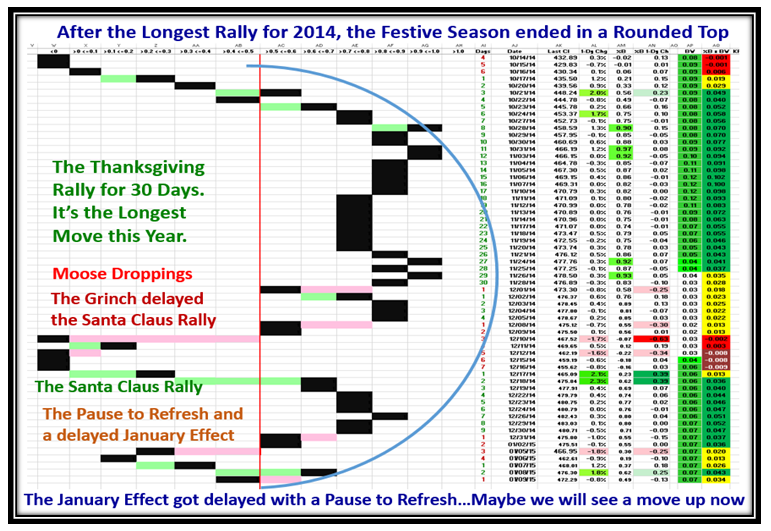
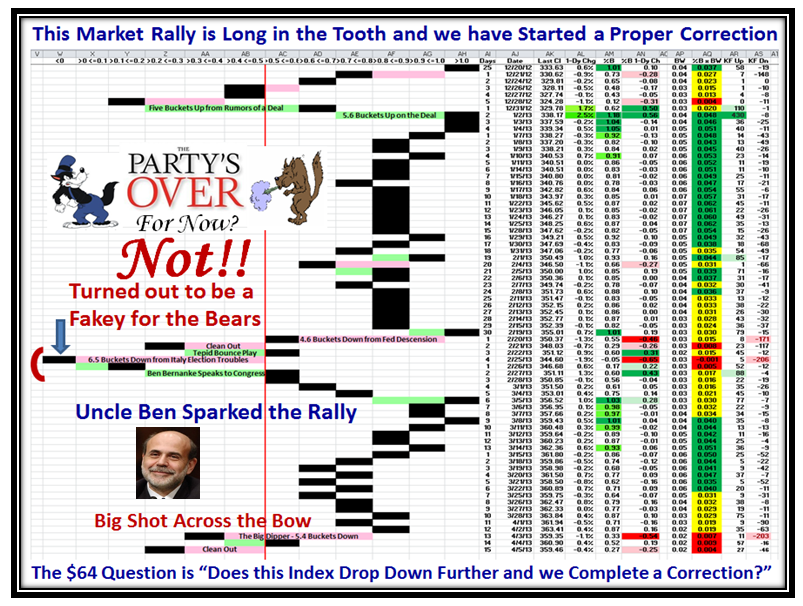
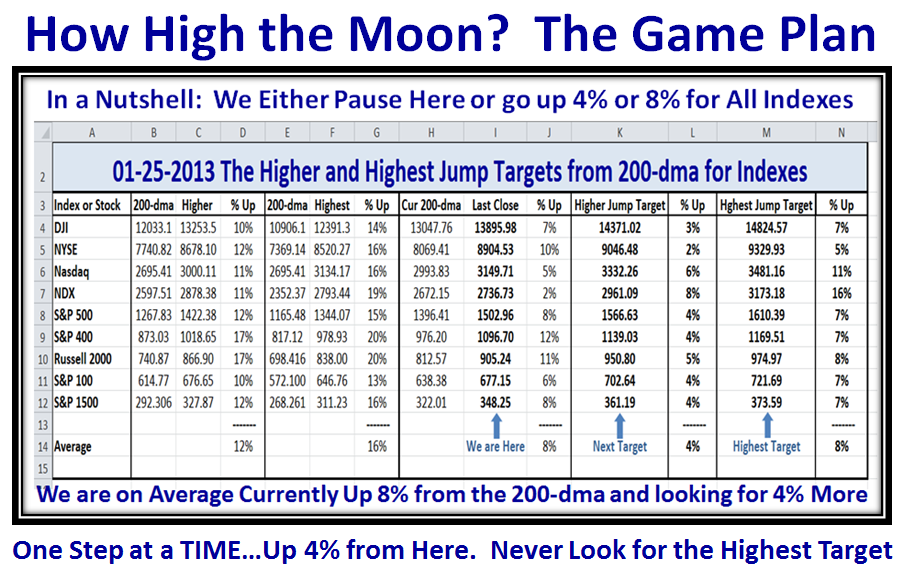
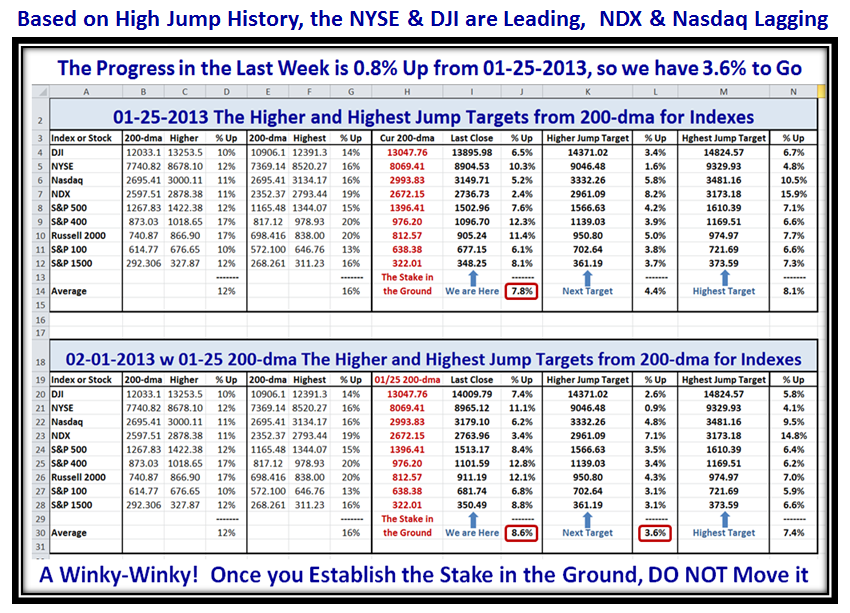
Nobody knows whether we will be on the High Road Scenario for a day, two days, a week or a month, but now the job is to measure from “whence we came” and where our next targets sit.  You’ve got it, ALWAYS turn to the High Jump at this stage.  We can see that we have progressed 0.8% of the 4% I said over a week ago for the Indexes to hit a 4% rise from 1/25/2013 for the High Road Scenario.  If you have become a believer in this approach, then my Winky-Winky for today is unlike the Super Bowl which will start in another hour and a half, DO NOT move the STAKE!  This following picture kills several birds with one stone.  It not only shows which Indexes are leading or lagging, but also what the progress has been since the last measurement and how much further to go to reach the next rung up the ladder.  If you keep moving the Stake each week, then you don’t have a feel for progress.  More importantly, since the 200-dma will also move up, the Targets move up somewhat with it, and therefore it’s in effect exagerating the catch up required from when you first took the measurement.

Overdrive High Jump

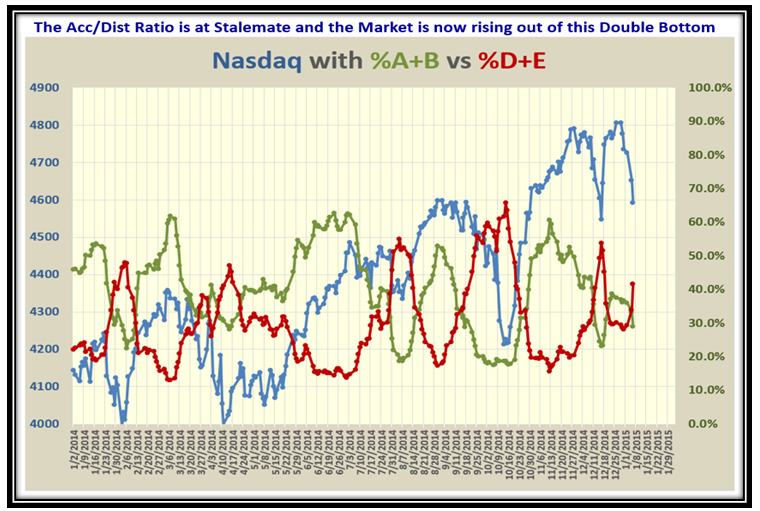
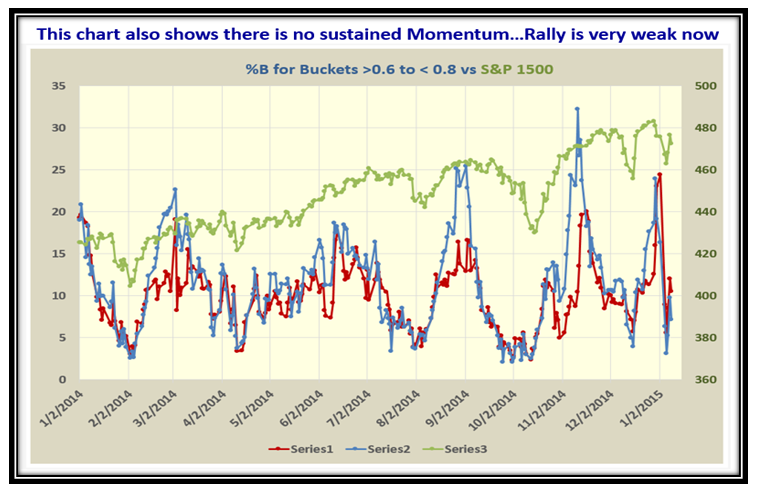
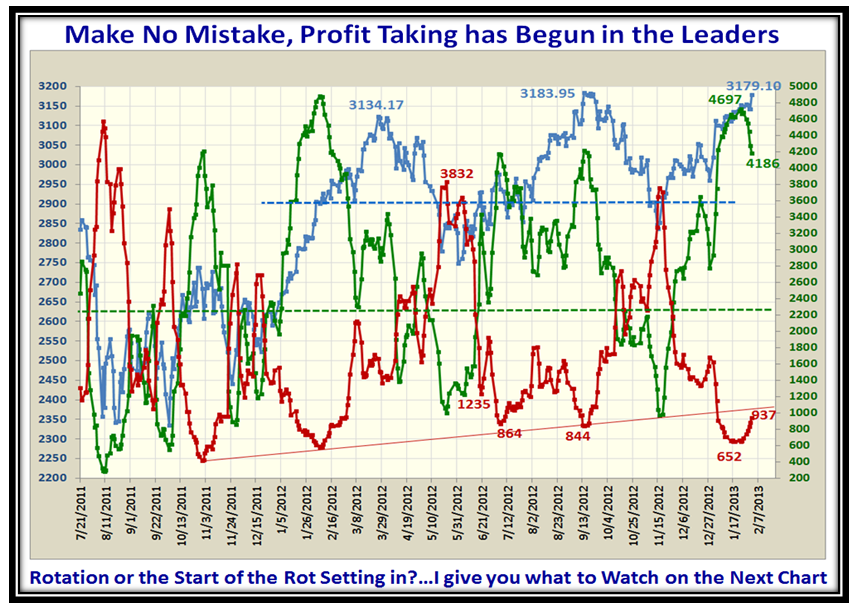
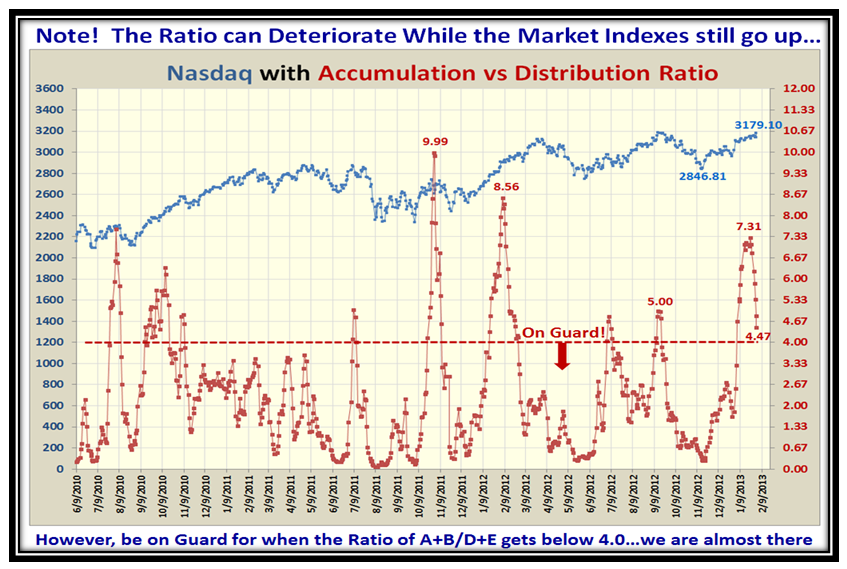
Your homework is not done.  We have only worked the positive side of the equation.  Now we must spot the divergencies.  The first one is to watch the Accumulation vs. Distribution situation and as one would begin to expect there are now the first signs of deterioration in the ratio.  The Accumulation has begun to turn down and naturally the Distribution has started to curl up:

Overdrive Acc

Now note the Ratio…Close to the On Guard Line, but this can still go down further before the Nasdaq corrects:

Overdrive Ratio

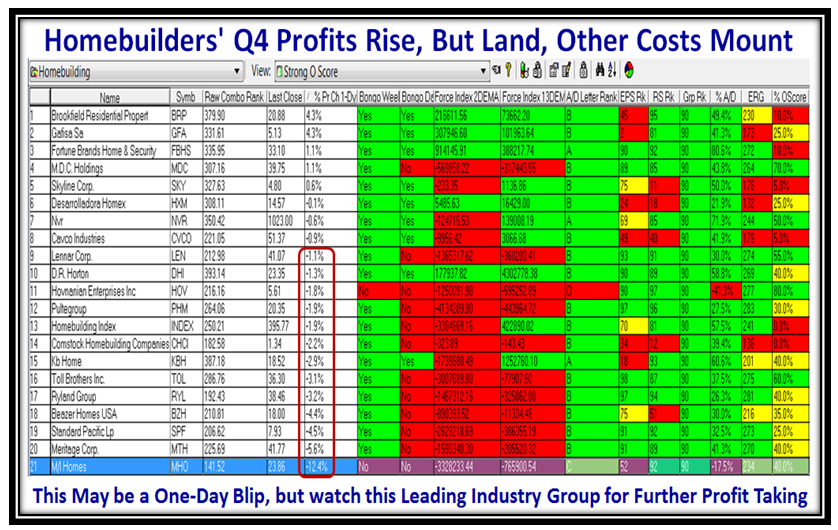
Now. let’s look for other possible deterioration, and bring the power of the HGSI Software into Play.  Friday was an unusual day for the Homebuilder Industry Group. The Industry Group was down 1.9%, the second worst on the day with Leisure Facilities at the bottom with -4.8%.  PulteGroup (PHM), Meritage Homes (MTH), MDC (MDC) and MI Homes (MHO) reported fourth-quarter earnings early, with Standard Pacific (SPF) out after the closing bell. All are benefiting from a gradually improving economy, low interest rates and a constrained supply of new homes.

Rising land prices, costs associated with buy-back reserves for bad loans from the housing boom and other costs pose a challenge.

Overdrive Homebuilders

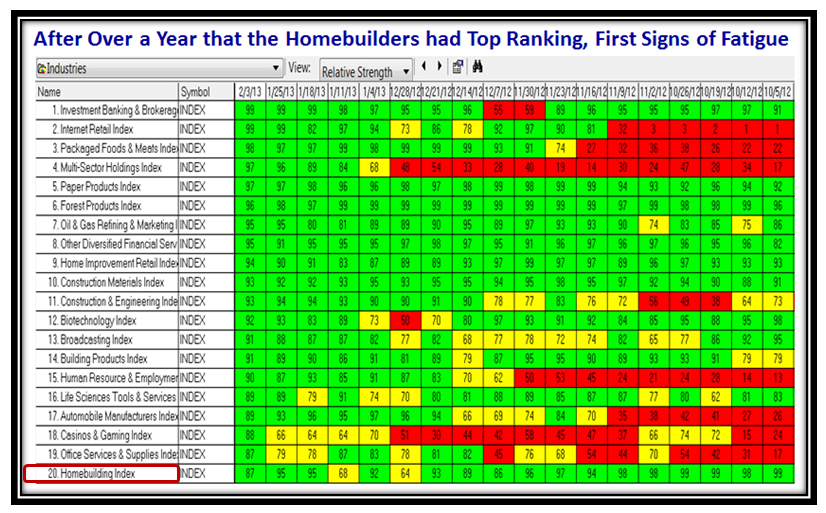
…And now let’s look at the Ranking Module and we begin to see some deterioration…it’s only natural as this Group has been top ranked for all of 13 months with colossal Price gains.  The question is whether this was a one day hiccup or rotation out to come?

Overdrive Homebuilders2

Now the homework is done and it’s time to settle back, put my feet up and enjoy the Super Bowl!

Best Regards,

Ian.

Stock Market: How High the Moon? Game Plan

Saturday, January 26th, 2013

Having achieved the recent Targets of 1500 on the S&P 500 and 900 on the Russell 2000 (RUT), the question on all our minds is “Now What?”  I hope the picture below hits a chord with you as we try to make sense of where the Stock Market is headed:

Moon Picture

Here is the latest picture of how the Market Indexes keep heading up into new highs, week after week, slowly but surely:

Moon Indexes

It is interesting that while the Indexes have inched up the %B is stuck in 2nd gear but healthy at between 0.8 to 0.9 for all of two weeks.  That gives us some comfort in that we have a cushion for even a five bucket knee jerk but still have room to trot up:

Moon Pat 2

The unusual pattern these last two weeks led me to look back to 2011 and 2012 at around this time of the year, and I may have struck oil.  Not only did I find a similar pattern, but also noticed that on both occasions we had a Five Bucket Knee Jerk down that turned out to be a Fakey of just a day or two before the Market shot back up to go on to new highs!  I know the old swan song that History seldom repeats itself, but at least it has become one of the Three Road Scenarios I will leave you with and in my usual manner I borrow “snippets from the past” to put on the present to show you what might happen should this phenomenon occur  for the 3rd year in a row.  I am not suggesting it is the expected scenario, but my point is to not be too quick to count your chickens that the market is headed down.

Moon Pat 2b

Please also note the similarity of heading back up to the tune of a 5% Gain in the Index Price after the Fakey, which happens to be approximately what one would look for to reach the next level of targets which my work on the High Jump will show you.

When things reach such peakiness, I ALWAYS turn to my trusty High Jump Tool to guide me of what are REASONABLE Targets, particularly for the Market Indexes.  In the following chart I have developed Past Higher and Highest results for the 200-dma to the price of the Indexes, and then applied these to the Current Last close as shown in the Middle Column to get the Higher and Highest Targets going forward.  Whether this unfolds this way is in the lap of the gods, but at least it sets reasonable goals of when enough is enough for you to think about running for the hills or shorting the Market:

Moon Game Plan

I hope by now with all the signals you have come to understand and enjoy about %B and 1-Day Change that you feel we have a warning system when unusual activity leads to big bucket skips.  Likewise, when things are calm that is a MAJOR clue that the Big Guns are not selling into this overbought rally with any fervour as yet.  Now that I have indicated the possibilty of a Knee Jerk look over to the right hand side of the next chart for what one should expect to see.  More importantly as I have hammered home previously, we need to see several Kahunas in quick succession before we know that the Wall Street Gurus have done their propping up while quietly selling into it and are now ready to bring down the hammer and open up the floodgates as the herd gets panicked into selling en masse.

Moon Big Guns

I wind up this blog with the three Road Scenarios, but before I do,  I have chosen to kill several birds with one stone by choosing what I have called the Middle Road Scenario to show what the results might look like with a Knee Jerk Fakey before either the S&P 1500 or Russell 2000 (RUT) recover to seek the higher range of targets I set forth earlier.  Enjoy:

Moon S&P 1500

Moon RUT

In my scheme of things, I always develop three scenarios so that I am not caught off guard.  I know many of you who have attended our HGSI seminars have incorporated that concept into their daily business in addition to their investing habits.  They have also learned to never fall in love with one scenario too far in advance, but to let the Market tell you which one it is on, so as a wind up to this review, here is that chart:

Moon roads

Thank you to those who took the time to give me some feedback and comments; it makes it all worthwhile to hear from you.  By the way, if you haven’t learnt the trick of clicking on any of these charts to make them bigger, shame on you.  Then you can use snagit to capture a copy for your files to review at your leisure.  I strongly suggest you do so with the High Jump Chart showing the targets and keep it by your elbow at your desk!

Best Regards,

Ian.

Copyright © 2007-2010 Ian Woodward
Disclaimer: Commentaries on this Blog are not to be construed as recommendations to buy or sell the market and/or specific securites. The consumer of the information is responsible for their own investment decisions.