
Indicator Category: Moving Averages
Indicator Filter Fields: Yes
Indicator Report: No
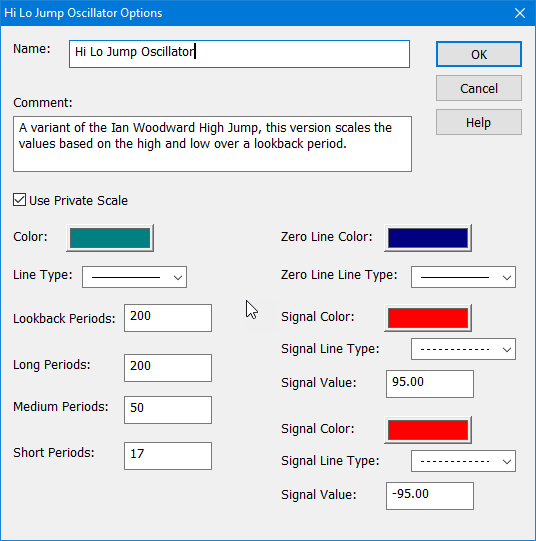
A variant of the Ian Woodward High Jump Indicator. This version scales the values based on the high and low over a look-back period. You can use the data field % Hi Lo Jump Osc under Technicals > Pct Close to filter or display in the Warehouse
.
The High Jump indicator is computed by taking three simple moving averages of the stock's close, the long/medium/short moving averages.
The indicator allows you to alter the time frame of these moving average. The default is 200, 50, 17. The stock's high value for the day is compared to each of these moving averages as percentage. This difference between the day's high and the three moving average is summed for each day. For every day in the lookback period's timeframe the maximum positive and the maximum negative value is computed. The Hi Lo Jump Oscillator is the percent difference between that day's high jump and that record high or low value, depending on if the day's high jump is positive or negative. This gives the Hi Lo Jump Oscillator a range of 100 to -100 %. With a value of 100% meaning today's high jump is at the highest positive high jump for the last lookback period of days. And a value of -100% meaning today's high jump is at the lowest negative high jump for the last lookback period of days. This is a line plotted by the indicator.
The indicator also has options for marking several signal line points, a zero line and a positive and a negative signal line.
The most recent Hi Lo Jump Oscillator value for the stock using a 200 day lookback and a 200, 50, 17 day moving average. This value is a measure of how far away the stock's high is from the three moving averages. It is a percentage measure of the stock's extension from those moving averages on a 200 day basis. Because it is a percentage it can be compared to other stocks as well as itself unlike the traditional high jump value which is just a raw numeric value.