Indicator Category: Volume Price Analysis
Indicator Filter Fields: Yes Volume Price Analysis - Data Fields
Indicator Report: No
This document provides detailed information about the HGSI VPA Charting Indicator and the VPA database fields associated with the indicator.
When a new copy of HGSI software is installed it comes with a large variety of ready to use VPA Charting Views and Warehouse Views of the database fields. It also contains many Filters needed for doing scans and Combo Ranks to create viable lists of stocks. Filters, Views and Combo Ranks in the HGSI product can be found in folders under the name of HGSI Volume Price Analysis. After installation of the software, when new or changed filters, views and combo ranks become available they are provided as add-ons that can be downloaded from the HGSI Website or from the help menu on the HGSI software toolbar.
HGSI Volume Price Analysis (VPA) is based upon concepts originally popularized by Richard Wyckoff and Jesse Livermore nearly a century ago to read “the tape” to determine what the "smart money" was doing.
Tom Williams of TradeGuider was the first to computerize the indicator which he refers to as Volume Spread Analysis (VSA). Others have followed Tom William's lead. Both VPA and VSA use the same concepts. Karthik Marar who coded VPA for AmiBroker, placed his code in the public domain.
The best explanations of VPA are by Anna Coulling in her book, A Complete Guide to Volume Price Analysis
VPA Flag - definition: The chart is annotated with a unique image for a price bar when that price bar meets specific conditions. Those images are identified and explained in the HGSI Volume Price Analysis Flag Guide table in this document.
VPA Signal - definition: The chart is annotated with a vertical bar from the top to bottom of the window for a price bar. For a "VPA Signal" to appear, the price bar must have 100,000 or more daily volume. It also has to meet other internal conditions that do not appear on the chart.
IMPORTANT: The VPA Signals and VPA Flags are independent of each other. Flags can occur without a VPA Signal and VPA Signals can appear without any VPA Flags.
Data Requirements: This indicator requires at least 120 (24 weeks/6 months) days of data to compute moving averages, plus an additional 30 days for the standard deviation computation. If the stock does not meet these data requirements no VPA Signals or VPA Flags will appear. IPOs are one example of where VPA signals will not appear. Another is the first 24 weeks of any multi-year stock.
|
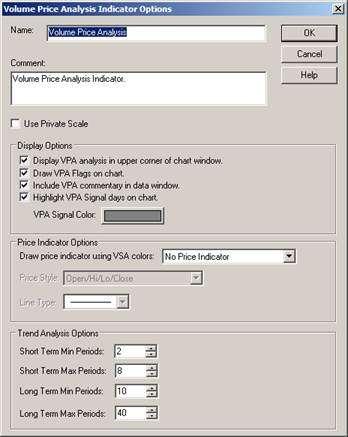
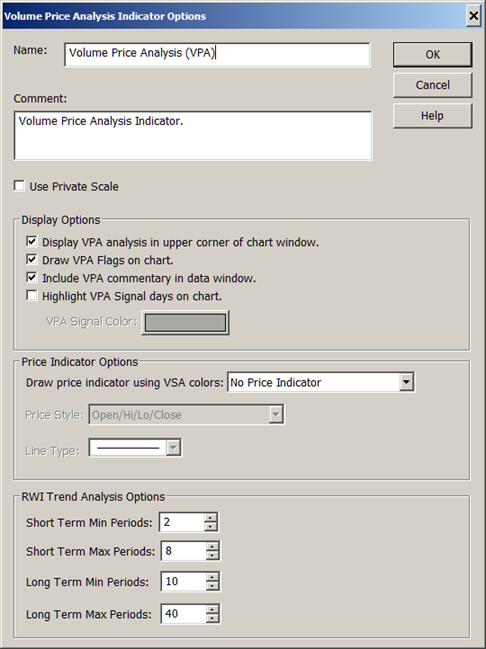
Name: Your name for the indicator Comment: Your description for this indicator Use Private Scale: Not recommended This indicator annotates price bars with VPA Flags. If the Private Scale option is used the VPA Flags will not be aligned correctly on the price bars.
|
 Display VPA analysis
in upper corner of chart window
Display VPA analysis
in upper corner of chart window
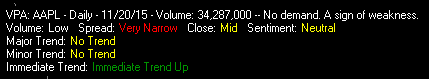
VPA:
Shows stocks symbol, mode of the chart,
date, volume, text description of the VSA signal. The VPA analysis
will also appear in the Data Window (see below).
Volume: The volume compared to the 90 day average volume.
Very High |
Twice average volume |
High |
1.3 times average volume |
Above Average |
Higher than average volume |
Less than Average |
Below average volume but above 70% of average volume |
Low |
Below one standard deviation of the average volume |
Spread: The day’s price range compared to the average spread. The spread is the stock’s intraday high minus its low. The average spread is a 90 day simple moving average of the spread. So for example if a stock’s intraday high is 100 and intraday low is 90, the spread is 10. This is computed for every day of the chat, then averaged over 90 days.
Wide |
Greater than 1.5 times the average spread |
Above Average |
Above the average spread |
Below Average |
Below the average spread but above 70% of the average spread |
Narrow |
Above 50% but less than 70% of the average spread |
Very Narrow |
Less than 50% of the average spread |
Close: The day’s close value compared to the spread and the day's low value.
Very High |
Close above 75% of spread |
High |
Close above 70% of spread |
Mid |
Close between 30% and 70% of spread |
Down |
Below 30% of spread |
Sentiment: The day’s sentiment Bullish, Bearish, Neutral
Trends: All three of the trends are determined through the use of a long and short term Random Walk Indicator (RWI). The parameters for controlling the RWI are shown below under Trend Analysis Options.
Trends |
Trend Direction Displayed |
Comments |
Major Trend: |
Up/Down/No Trend |
Major Trend has an additional status description of Major Uptrend Ended and Major Down Trend Ended. E.g. No Trend Major Down Trend Ended. |
Minor Trend: |
Up/Down/No Trend |
|
Immediate Trend: |
Up/Down/No Trend |
Draw VPA Flags on chart.
When this option is turned on Flags will be annotated on the price bar indicating a certain condition had occurred. See the VPA Indicator Flag Guide below for explanations of the various flag conditions.
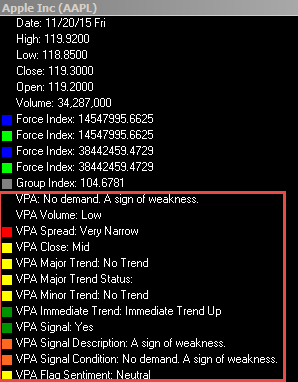
Include
VPA commentary in data window
The data window displays data for the price bar under the chart cross hairs.
 )
)
Highlight
VPA Signal days on chart
VPA Signal Color button: The default color is gray. Press the VPA Signal Color button to change the color.
For the VPA Signal (vertical colored bar) to be annotated on the chart it needs to have at least 120 records to compute fully, plus 30 days for standard deviation computation, about 24 weeks/6 months of data. IPOs are an example where VPA Signals will not be available for the first 120 days. Once the number of record requirements are met, the daily volume must be higher than 100,000
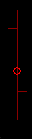
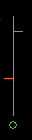
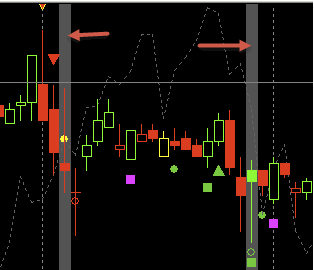
On the chart snippet below are two instances of the VPA Signal (vertical bar). They are pointed to with the red arrows. Those VPA Signals shown below also have VPA Flags. Those flags have a their own meaning (see the VPA Flag Guide below). It is not necessary for a VPA Signal to also have a VPA Flag.
There are also numerous examples on the snippet were VPA Flag images are present but without the VPA Signal. (The VPA Signal and the VPA Flags are two separate systems for generating annotations on the VPA chart indicator).
PRICE INDICATOR OPTIONS
Draw Price Indicator using VSA colors:
The default is No Price Indicator.
The VSA coloring rules
are based on volume.
(see VSA Colored Price Indicator Color Guide)
The trend coloring
rules are based on the trend direction.
(see Trend Colored Price Indicator Color Guide)
NOTE: When the VSA or Trend Colored Price Indicator option is selected the normal default Charting Price Indicator should be removed from the window where the VPA Indicator will be used, otherwise two copies of the price will be drawn in the window.
Price Style:
Open/Hi/Lo/Close
Candlesticks
Line
Hi/Lo/Close
Line Type:

VSA Colored Price Indicator Color Guide
Colors are based on the condition of various signals. The color of the price bar is determined by whatever signals are positive for that day starting at the top of this table. First signal to match decides the day's color.
|
|||
Color |
Flags |
Condition |
|
Turquoise |
|
lowVolTest |
Test for Supply |
Pink |
|
distributeBar |
High volume up bar closing down in uptrend. |
Dark Red |
|
ownerTransfer |
Wide-range bar on volume at least 1.5 times avg |
Yellow |
|
upThrustBar |
Price moves above resistance of trading range |
Lime |
|
bullBar |
Bullish Bar |
Red |
|
bearBar |
Bearish Bar |
White |
|
noDemandBar |
Sign of weakness |
Magenta |
|
noSupplyBar |
Sign of strength |
Green |
|
upBar |
Todays close is up vs yesterday |
Orange |
|
downBar |
Todays close is down vs yesterday |
Blue |
|
--- |
Flat line. Neither up or down |
Trend Colored Price Indicator Color Guide Trend is determined by computing 3 best fit lines (40 period, 10 period and 3 period) against a 5DMA. A value above 0 means the stock is trending up during that time period, less than 0 the stock is trending down.
|
|||||
Color |
|
3 Period |
10 Period |
40 Period |
Condition |
Lime |
|
ShortTerm > 0 |
MediumTerm > 0 |
LongTerm > 0 |
All three time periods are trending up. |
Green |
|
ShortTerm > 0 |
MediumTerm > 0 |
LongTerm < 0 |
Trending up in short and medium time periods, down in long time period. |
Pale Green |
|
ShortTerm > 0 |
MediumTerm < 0 |
LongTerm < 0 |
Trending up in the short time period only. |
Red |
|
ShortTerm < 0 |
MediumTerm < 0 |
LongTerm < 0 |
Trending down in all three time periods. |
Pale Green |
|
ShortTerm < 0 |
MediumTerm > 0 |
LongTerm > 0 |
Trending up in the medium and long time periods only. |
Orange |
|
ShortTerm < 0 |
MediumTerm < 0 |
LongTerm > 0 |
Trending up in only the long time period. |
Blue |
|
--- |
|
|
Neutral |
TREND ANALYSIS OPTIONS
These control the length of the Random Walk Indicator used to compute the trend direction. The default settings are a short term minimum of 2 and a maximum of 8, a long term minimum of 10 and a long term maximum of 40.
These defaults are also used to compute the HGSI Warehouse columns for VPA Signal. You can alter these time frames to change the Random Walk Index to get a faster or slower trend, but your results will no longer match the fixed Warehouse column computations.
The HGSI Warehouse and Filter have a number of data fields with values computed using the same calculations as the VPA Charting Indicator. These fields are described below.
Warehouse VPA Signal Color Guide Warehouse column colors used for the VPA Signal Condition and the VPS Signal Descriptions.
|
||
Color |
Condition |
|
Yellow |
|
strengthDown or strengthDown1 |
Pale Green |
|
buyCond |
Pale Green |
|
strengthDown2 |
Light Orange |
|
upThrustBar or upThrustCond1 |
Orange |
|
upThrustCond2 or upThrustCond3 |
Lime |
|
effortUp |
Red |
|
effortDown |
Light Orange |
|
PseudoUpThrust |
Orange |
|
pseudoUtCond or noDemandBar |
Yellow |
|
strengthDown0 or noSupplyBar or lowVolTest or lowVolTest1 or lowVolTest2 |
Yellow |
|
stopVolume or revUpThrust |
Orange |
|
upThrustCond1 |
Light Orange |
|
distributeBar |
Light Orange |
|
trendChange |
Warehouse & Filter Fields |
Filter Values |
Warehouse Value |
Days Since Last VPA signal |
Number |
0,20,13 |
Last VPA Signal Condition |
Text for string search |
(e.g. “No Demand”) |
Last VPA Signal Description |
Text for string search |
(e.g. “A sign of weakness”) |
VPA BF Trend Long |
Up/Down |
Up/Down |
VPA BF Trend Medium |
Up/Down |
Up/Down |
VPA BF Trend Short |
Up/Down |
Up/Down |
VPA BF Trend Percent |
% of the Up/Down Warehouse Values |
-100%/100%/33.33%/-33.33% |
VPA Flag No Supply Bar |
Yes/No |
Yes/No |
VPA Flag Reverse Up Thrust |
Yes/No |
Yes/No |
VPA Sentiment |
Bullish/Bearish/Neutral/(no flag) |
Bullish/Bearish/Neutral/Blank |
VPA Flag Stopping Volume |
Yes/No |
Yes/No |
VPA Flag Transfer of Owner |
Yes/No |
Yes/No |
VPA Flags VPA Flags-1 |
||
VPA Signal VPA-1 Signal |
Yes/No |
Yes/No |
VPA Signal Condition VPA-1 Signal Condition |
Text for string search (e.g. “No Demand”) |
(e.g. No Demand”) |
VPA Signal Description VPA-1 Signal Description |
Text for string search (e.g. “A sign of weakness") |
(e.g. “A sign of weakness") |
Flags are the image-shapes associated with a price bar. Price Bar Description describes the condition of the price bar.
FLAG NAME AND DESCRIPTION |
FLAG |
PRICE BAR DESCRIPTION |
VPA TEXT DESCRIPTION (Shown in upper left corner of chart window) |
SENTIMENT |
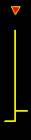
Bc: Red down triangle with yellow border, above daily high
|
|
Wide-spread high volume up bar. Often closes near its low in an uptrend, but not always. If it does close near the low of its range, it is a stronger signal. |
An upthrust bar. A sign of weakness
A potential buying climax, a wide range bar on heavy volume. (buying climax) |
Neutral
|
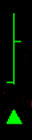
buyCond: Lime up triangle below daily low |
|
Wide-spread high-volume up bar closing near high, with previous high-volume bar |
An up bar closing near its high. Confirms return of strength.
|
Bullish
|
confirmWeak1: White box below daily low |
|
Price dips below daily low but closes above it. Sentiment is bearish, but easing. |
Test for Supply. (this text is added to beginning of other text messages so it appears first)
Selling pressure is easing in a downtrend as price closes off of the daily low. (test for supply) |
Bearish
|
distributeBar: Blue box above daily high |
|
Wide-spread high-volume up bar closing near its low in an uptrend |
Pseudo upthrust. A sign of weakness
A wide range, high volume bar in an uptrend. Closing down is an indication that distribution is in progress. (smart money selling) |
Bearish
|
effortDown: Yellow circle at midpoint of bar |
|
Wide-spread high-volume down bar closing near its low. Fear dominates. |
Effort to fall. Bearish sign.
The security is showing signs of weakness with a close near the low of its daily range on a wide range bar. (effort to fall) |
Bearish
|
effortUp: Turquoise circle at midpoint of bar |
|
Wide-spread high-volume up bar closing near its high |
Effort to rise. Bullish sign.
Normally found in the beginning of a markup phase and is a bullish sign. These may be found at the top of an Upmove as the Smart money makes a last effort to move the price to the maximum. (effort to rise) |
Bullish |
effortUpfail |
|
|
Effort to move up has failed. Bearish sign. |
Bearish |
lowVolTest: Magenta box below day low |
|
Wide-spread low-volume bar closing near its high and above prior day's low |
Low Volume Test.
Bar closes near the top of its daily range as traders “test” the market for supply and find that demand is greater than supply. Volume is generally light. (test for supply) |
Bullish
|
lowVolTest1: Lime box below daily low |
|
Wide-spread low-volume bar closing near its high |
Strength seen returning after a down trend.
The current bar is a upbar with higher volume. This confirms strength is returning after a down trend. (test for supply in a downtrend) |
Bullish
|
lowVolTest2 Yellow up triangle below day low |
|
Wide-spread low-volume bar closing near its high with prior bar printing a test for supply |
An upbar closing near high after a test confirms strength.
The previous bar was a successful test of supply. The current bar is a upbar with higher volume. This confirms strength (second test for supply) |
Bullish
|
noDemandBar: Magenta box above day high |
|
Any low-volume bar closing near its low in an uptrend |
No demand. A sign of weakness.
Any up bar which closes in the middle or low, especially if the volume has fallen off, is a potential sign of weakness. (test for demand) |
Neutral
|
noSupplyBar: Lime circle below day low |
|
Any low-volume bar closing near its low |
No supply. A sign of strength.
Security closes in the lower part of its daily range, but on lighter volume. This indicates selling is subdued, even though the close is generally lower than the open. It is better to wait for confirmation. (test for supply) |
Neutral
|
Nut: Lime down triangle above day high |
|
Wide-spread high-volume bar closing near its low after a new high (rare). Potential end of a rising market or a buying climax. |
Reached new recent high on higher volume but failed to hold.
Example of nut: ACTG on 4/20/2012 |
Bearish |
ownerTransfer: Hollow red circle at day midpoint |
|
Wide-spread high-volume (>1.5x avg vol) bar closing about mid range |
Transfer of ownership.
A wide-range bar on volume at least 1.5 times average where the bar closes around mid-range. Bulls and Bears transfer shares as they fight for control. (indecision) |
Neutral |
PseudoUpThrust: Blue box above day high |
|
Wide-spread bar closing near its low in an uptrend |
Pseudo upthrust. A sign of weakness
This looks like an upthrust bar closing down near the low but the volume is normally lower than average. This is a sign of weakness. If the volume is high then weakness increases. (Smart money is selling) |
Bearish
|
pseudoUtCond: Blue down triangle above day high |
|
Wide-spread bar closing near its low in an uptrend with prior bar printing a pseudo upthrust |
A down bar closing down after a pseudo upthrust confirms weakness.
Confirms weakness. If the volume is above average the weakness is increased. (confirms smart money is selling) |
Bearish
|
revUpThrust: Yellow box below day low |
|
Wide-spread up bar closing near its high in a downtrend |
Strength seen returning after a down trend. High volume adds to strength.
Reverse upthrust. Indicates strength. (demand returning) |
Neutral
|
sellCond: Red down triangle above day high |
|
Wide-spread down bar closing near its low |
A downbar after an upthrust. Confirms weakness.
Similar to the topRevBar. Bulls lost control of the security as the day progressed. An upthrust bar after a move up is a sure sign of weakness. (supply returning) |
Bearish |
stopVolume: Hollow lime circle below day low |
|
Wide-spread high-volume down bar closing about mid-range in a downtrend |
Stopping volume. Normally indicates end of bearishness is nearing.
A stopping volume normally indicates smart money is absorbing the supply. An Indication that they are bullish on the market. A potential reversal in the down trend. |
Neutral |
strengthDown: Lime box below daily low |
|
Wide-spread high-volume up bar closing near mid-range in a downtrend |
Strength seen returning after a down trend.
The stock has been in a down trend. An upbar with higher volume closing near the high is a sign of strength returning. The Down trend is likely to reverse soon. (stopping volume) |
Neutral |
strengthDown1: Lime box below daily low |
|
Wide-spread high-volume up bar closing near high in a downtrend |
Strength seen returning after a down trend.
A security in a down trend is now showing signs of strength on higher than normal volume. (stopping volume) |
Neutral |
strengthDown2: Aqua up triangle below day low |
|
Wide-spread upbar closing near its high in consolidation. |
High volume upbar closing on the high indicates strength.
High volume upbar closing on the high indicates strength. (demand returning) |
Neutral |
topRevBar: Blue circle above day high |
|
Wide-spread high-volume down bar following an up bar (rare) |
Reached new recent high but failed to hold.
Example of topRevBar: MSFT on 06/04/2013 |
Neutral
|
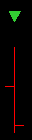
trendChange: Yellow down triangle above day high |
|
Wide-spread high-volume down bar in an uptrend |
High volume downbar after an upmove on high volume indicates weakness.
The stock has been moving up on high volume. The current bar is a downbar with high volume. Indicates weakness and probably end of the up move. (supply returning) |
Bearish |
upThrustBar: Red with yellow border down triangle above day high |
|
Wide-spread high volume up bar closing near its low |
An upthrust bar. A sign of weakness.
Up-thrusts are seen after there has been weakness in the background. Market makers know the market is weak, so the price is marked up to encourage traders to go long in a weak market, and panic traders that are short into covering their position. (supply returning) |
Bearish
|
upThrustBartrue: White box above day high |
|
Wide-spread high-volume down bar closing at its low |
An upthrust bar after up move. A sure sign of weakness.
Volume is above average. (supply returning) |
Bearish |
upThrustCond1 |
|
|
A downbar after an upthrust. Confirms weakness. |
Bearish |