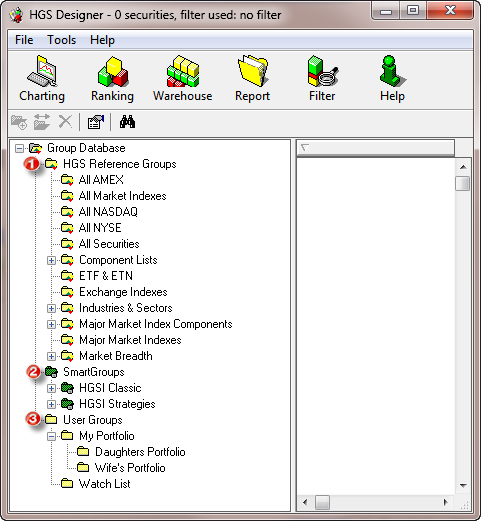
Designer Group Database
- Reference Groups (defined by the HGSI software)
- Custom Groups (the results of a HGSI custom solution)
- Smart Groups (created using HGSI filtering and ranking tools)
- User Groups (your custom designed groups)
These groups give you a quick way to find a starting set of stocks to rank and compare.
Each stock in the group database has over 400 fields of technical and fundamental performance information about the stock.
Because we pre-compute a large number of popular charting indicators and other technical measures, you can quickly narrow investment candidates to analyze with our stock charting features.
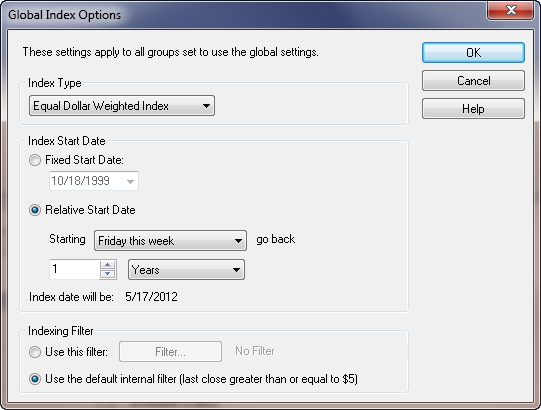
Group Indexes
This aggregation of individual stock information, such as revenue, earnings, market cap, and shares outstanding, allows you to do group comparative analysis of stocks, commodities, mutual funds, ETFs.
Rank comparisons of group indexes based on technical and fundamental information is a feature unique to HGSI.
A variety of index setting options are available such as weighted, average, and other index types. Start dates for the indexes can be on a fixed date or a date that starts relative to another date option that you select.
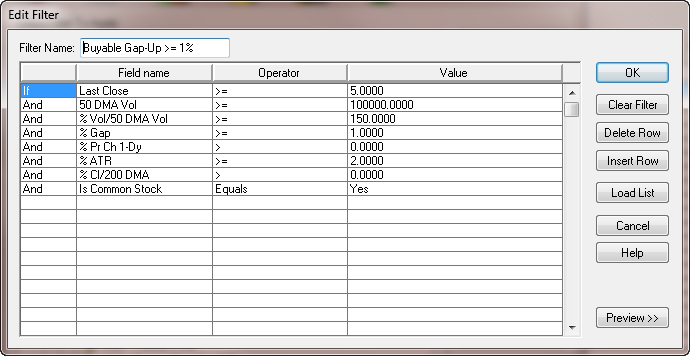
Filters
These operators evaluate over 400 data fields of information for each stock or index and quickly produce a list for further examination.
You can give the search a filer name to save it, and easily access your saved filters.
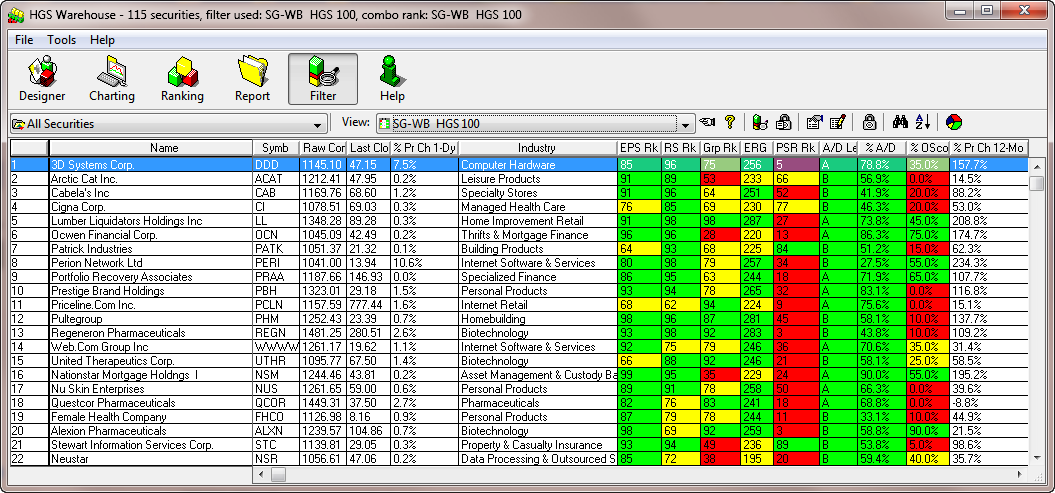
Warehouse
Each view can be given a name and saved to a list of Warehouse views. Link each view to a specific filter and combination rank. Anytime you bring up that view the group will be automatically filtered and ranked.
Flip through different views to see the group from many different perspectives. There is no limit to the number of views.
Use the real-time integration feature in HGSI to track a group of stocks with Quote-Tracker or export the view in ASCII or HTML for import into Excel or other programs.
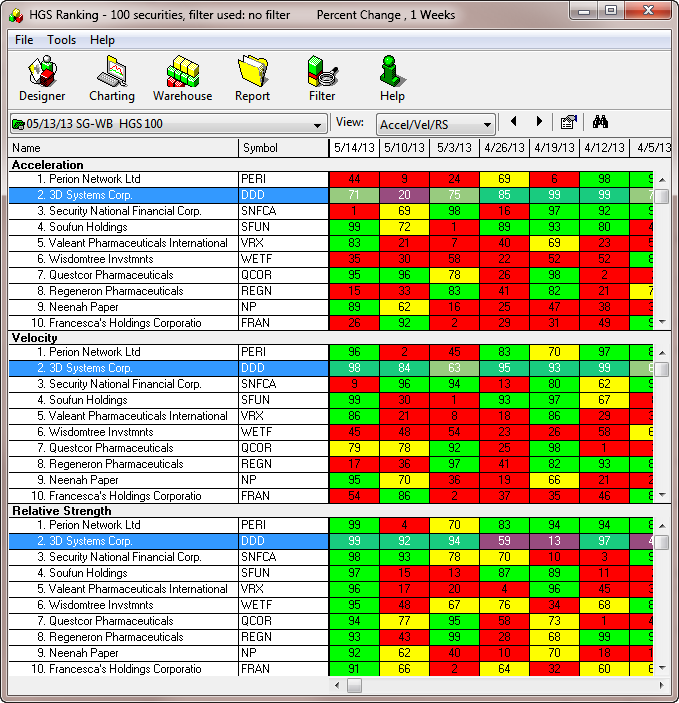
Ranking
- Relative Strength
Using the interactive ranking tool, rank all the stocks within a group using a variety of relative strength types such as Wilder RSI, Percent Change, and Comparative RS to another Security and get color coded historical relative strength, velocity and acceleration for each stock. - Weighted Combination Rank
Select as many data fields of information from the database as needed and assign weight (relative importance) to each data field. The securities in that group are then ranked on each of these fields, with the score combined together to produce a final ranking. The end result is a weighted combination sort of all the stocks in your group, bringing stocks with the best combination to the top of the list.
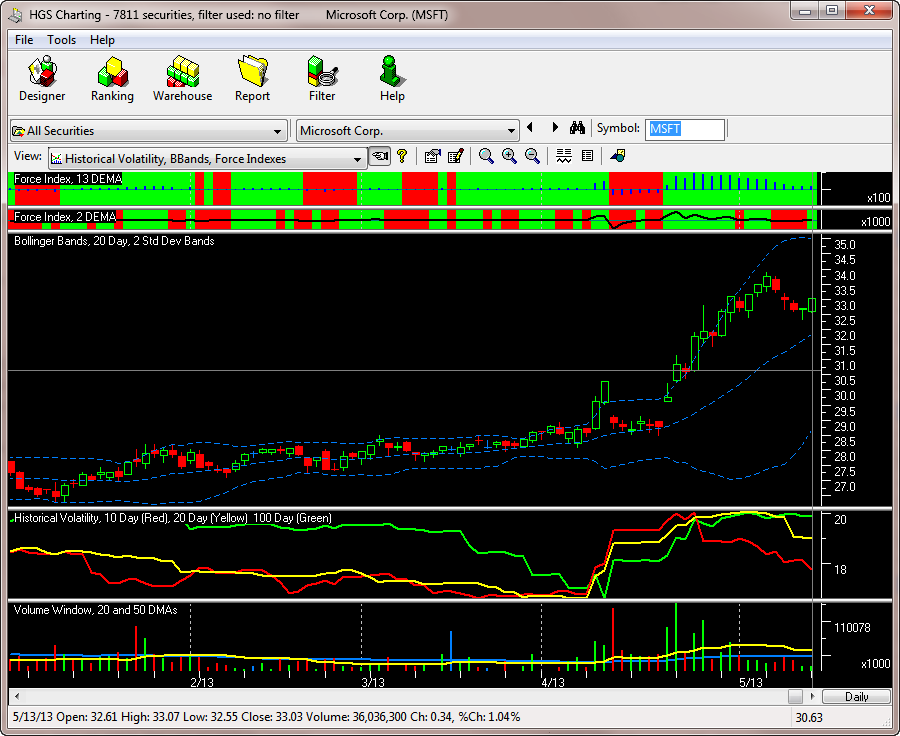
Charting
An unlimited number of views can be created each with different colors, indicators, annotations and more. There are over fifty indicators that cover a wide range of investment styles.
Fundamental and technical information for the stock being charted is displayed on five different rotating panels making it a snap to see eight quarters of earnings and revenue along with a mini-chart for the current and next quarters estimates.
HGSI charting offers a number of “index” specific indicators that are not possible with standard charting applications. These index indicators include:
- % Index Above 20DMA
- % Index Above 30DMA
- % Index Above 50DMA
- Index % Accum/Dist
- Index Adv?Dec Line
- Index Based Arms Indicator
- Index New High/Low Line
- McClellan Oscillator
- McClellan Summation Index
These types of indicators in traditional charting programs generally require importing the data in the form of a fake chart and other end user manipulations . With HGSI the data is already computed with the index and can be directly charted.
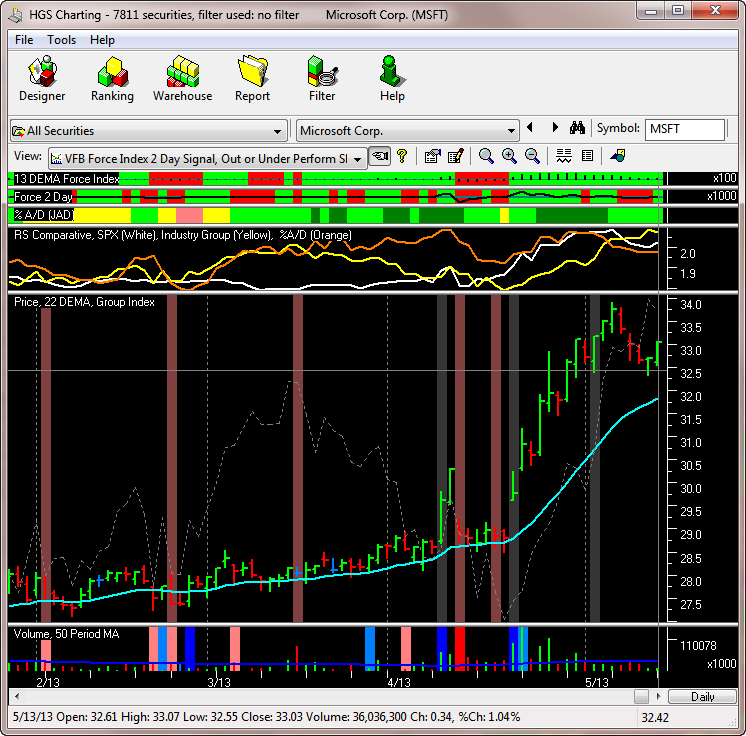
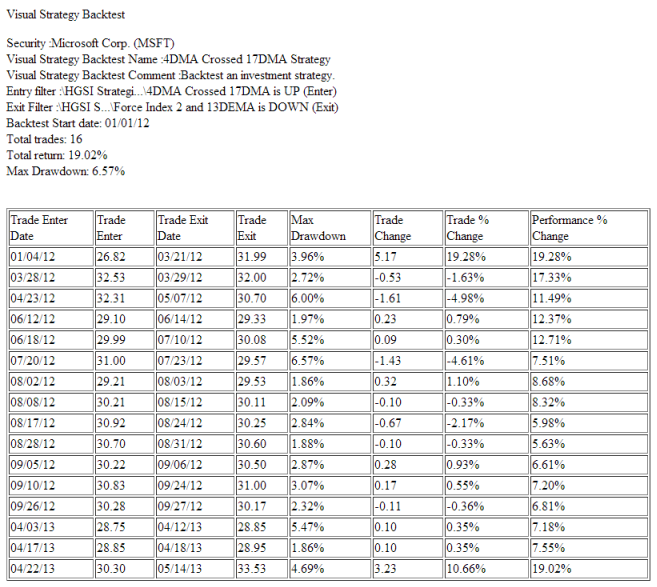
VISUAL FILTER BACKTEST
For example:
- the VFB produces a green color in the chart’s Price sub-window on the left, which indicates a particular market index condition identified as “Tsunami” by Ian Woodward.
- VFB is also being used in the Volume sub-window to show two other market conditions identified by Ian Woodward as Eureka (green) and Kahuna (black). These conditions are described in other documents.
Reports
- Save any Warehouse view as a HTML report. The HTML report can be printed or opened in Word or Excel. Color coded fields are saved with the original colors.
- The Group Performance Analysis HTML report answers questions such as, how did my groups perform? Did they do better than the S&P 500? Set report options for start and end dates and investment amount.
- The GPA report will show the % Chg from start to end; the gainers/losers and much more. If multiple groups are used in the report, a special section of the report will summarize and rank the groups on % Chg.
- What percentage of the stocks in a group are in each of the market sectors? The Spectrum Analyzer answer questions such as this and gives the composition of the group by creating a pie chart showing the distribution.
Software Integration
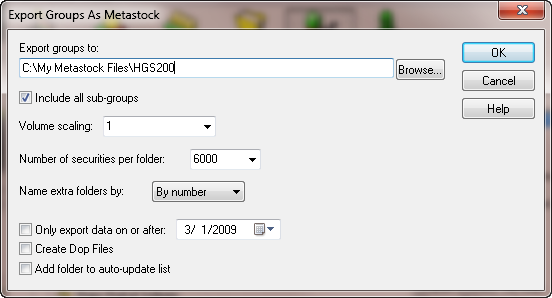
- Export stock data (including HGSI generated indexes) as ASCII
- Export and update stock data (including HGSI generated indexes as Metastock files, including support for larger than 255 stocks per folder
- Export HGSI Warehouse displays as ASCII or HTML (including color formatting)
- Export HGSI groups to MedVed Trader for real-time tracking of group performance
- Intraday updating using ThinkorSwim, Google and others