Ron Brown Investing, Insider Club Webinar – Wednesday, September 20, 2017
Prospecting and HGSI using Volume Price Analysis (VPA) Signals and Flags
FREE 30 DAY TRIAL OF HGSI INVESTMENT SOFTWARE
One of the great strengths of HGSI is the ability to prospect for potential trades with a variety of methods that are not available in other software packages. VPA Signals and Flags along with Volume Point of Control, Pocket Pivots, and Force Indexes are just some of the methods in HGSI.
For this month’s webinar I am going to focus on VPA Signals and Flags as a way to find trades based upon demand and supply. With VPA we can locate stocks that are in high demand and are breaking out, or at the other end of the spectrum, we can locate stocks that are beginning to show signs of accumulation after a downturn. I will cover these conditions, plus many other conditions as I go through the process during the webinar.
VPA gives us insight into potential trades which we may or may not be able to see with other indicators and methods. Not all VPA Signals and Flags indicate that an imminent move is about to begin, but when we start seeing multiple VPA flags at support, and/or resistance areas, this suggests that traders are accumulating or distributing that particular stock.
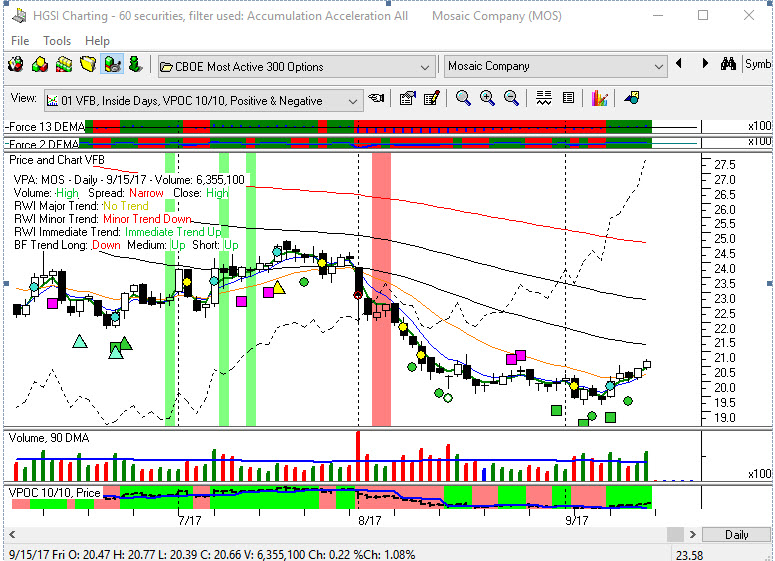
Mosaic Company, MOS is a good example of a stock that has been in the down trend and is lagging its group, but is also under accumulation as indicated by the multiple VPA Signals and flags and the positive Volume Point of Control indicator. We will look at stocks such as MOS during the webinar. I found MOS with one of the many scans I have in the Insider Club files.
Ron Brown
Ron Brown Investing (VPA)
Comments are closed.