Stock Market Early Morning Insights – July 5, 2016
Stock Market Early Morning Insights – July 5, 2016
I hope you had a safe and enjoyable Fourth of July weekend.
The obvious question is can the four-day rally continue? From the looks of the stock index futures early this morning, the answer is no, but of course that can change dramatically by the time markets open. On the daily and weekly charts, the major stock indexes are still trading within their consolidation or contraction areas, and there is strong overhead resistance just above.
World markets are mostly in the red overnight with the DAX down 1.56% as I write this. Other European markets are showing comparable losses, with the exception of the FTSE 100 which is up. I’m not sure why the FTSE 100 is trading up unless it is because the British pound is trading at a new 31-year low, and British stocks seem inexpensive to foreign investors. This is just speculation on my part, but it seems strange with all the turmoil in Great Britain, that the FTSE 100 is rallying.
I am continually amazed at the wealth of information that is available online, and in our trading platforms, and most of it is free. I doubt if most traders/investors look at the Intermarket relationships, but it is there for all of us to digest. As I look at my screen this morning, I can see that 30 year US treasury bond futures are trading at a new high, gold futures are up, and are challenging a high established in March of last year, silver futures are up, but it looks like a buying climax may have occurred this morning, crude light futures are down nearly 3%, and US stock index futures are down around two thirds of 1%.
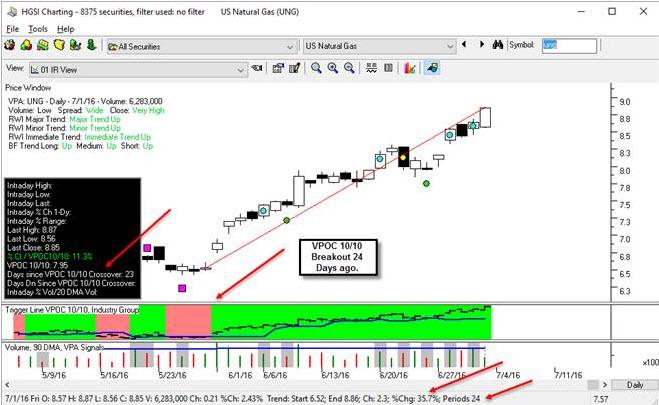
Natural gas futures are stalling today, down 3.18%, but that commodity has been one of the strongest over the past 1 ½ months. The natural gas ETF, the UNG, is up 36% over the past 1 ½ months. The symbol is contained in my major market ETF’s folder. This chart of the UNG shows the gap breakout back on May 31 on extremely heavy volume. On that same day, the volume point of control 10/10 kicked in to the long side, and has remained positive since. More natural gas being used today, so demand is outstripping supply.
To put the move up into perspective, we need to take a look at the quarterly and yearly charts of UNG. The high on in December 2008 was over $500! This just illustrates how much supply of natural gas has come onto the market, and how crazy this speculative fever was back in 2008.
With all the uncertainty surrounding Brexit, I am not taking on much risk at this point. The 30-year bond futures, gold futures, and silver futures are telling us that risk is high. The stocks that have been in favor are Precious Metal and Mining stocks, defensive stocks, REITs and utilities. The bond market is not pricing in any rising interest rates, and money is flowing in because bonds are considered as a safe haven. That is true, as long as they are or more buyers and sellers, but bond futures are heavily leveraged, and is not for the faint of heart or those without deep pockets.
Formula traders who look at history saw three so called follow through days last week, and the IBD staff labeled the market as being a confirmed uptrend. Until the indexes break above resistance levels on heavy volume, the markets are consolidating and are looking for direction. The four-day rally was nice, but I believe much of the rally was on short covering. Look where the money was flowing; it was not flowing into many of the growth stocks. The semiconductor group failed to follow through on Friday, and it is a group which needs to show consistent strength for a major rally to occur.
STOCK MARKET EARLY MORNING INSIGHTS
Stock Market Early Morning Insights is a product of Ron Brown Investing. The complete report and all the charts are produced daily before the market opens and distributed by email to subscribers. Reports published on the HGSI Blog are delayed and do not contain all the charts. For more information about subscribing use this link. MORE INFO
Comments are closed.