Stock Market Early Morning Insights – March 28, 2016
Stock Market Early Morning Insights – March 28, 2016
Thursday began the day with a bearish tone following Wednesday’s selloff, but by the end of the day the major market indexes had turned from being extremely negative to moderately positive.
At the beginning of the day the NYSE decliners led advancers by nearly 7 to 1, and the NASDAQ Composite decliners were leading around 5 to 1, but by the end of the light volume trading session, both indexes had turned slightly positive with advancers over decliners. The candle on the NASDAQ opened near the session low, traded slightly lower, then reversed throughout the trading day to close at 100% of its daily range. The S&P 400 mid-cap and the S&P 600 small-cap indexes had similar patterns with both indexes closing at 100% of their daily ranges. All three indexes closed the day with a bullish tone, much to the frustration of the shorts.
I know a lot of traders and investors are bearish on this market, but as long as we continue to see absorption volume like we saw on Thursday, and the trends remain positive making higher highs and higher lows, I think the Bulls have it. After the one-day selloff on Wednesday, the bullish momentum took control again on Thursday. I suggest that we focus on trends, price and volume, VPA signals, spreads and where stocks and indexes close relative to their intraday ranges. By the way, both the NASDAQ composite and the S&P 400 generated bullish test for supply VPA signals.
Tesla is the best example of a stock that helped turn the indexes around on Thursday. After two days of selling pressure, fear dominated at the open on Thursday as Tesla opened at $215.78, traded down to $215, and close the day at $227.75, up 2.32% for the day. It generated a Pocket Pivot on the intraday reversal, and is trading at $230.50 in the premarket. TSLA has been one of the leading stocks since his rally began, and the support that came into it on Friday as a selling was absorbed, indicates of the Bulls are not yet finished with Tesla. Any traders who shorted TSLA at the open on Thursday were feeling severe pain by the end of the session.
This is a daily chart of Tesla and one of the new charts that I am building for HGSI users. It is a volume at price chart with multiple volume points of control on the chart. The jagged blue line is the 10-day volume point of control graph line, and the horizontal lines represent VPOC’s of 250, 90, 30, and 10 periods. As you can see, there is strong resistance at the 250, 90 and 10 period VPOCs. If TSLA blows through these volume resistance areas, I think it can go much higher.
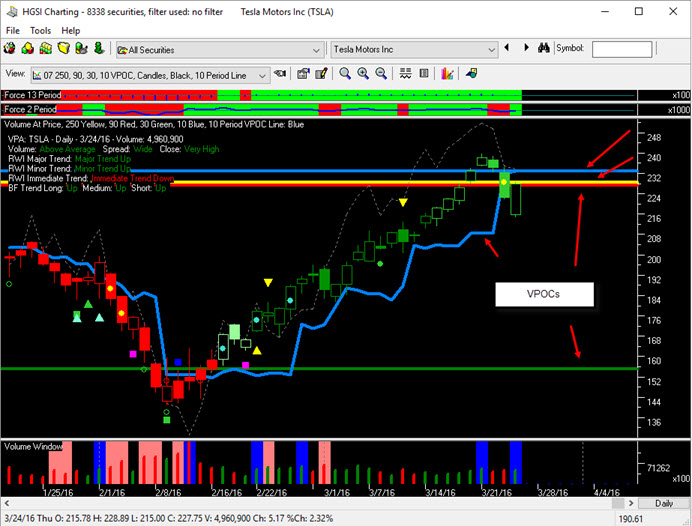
In this chart I have combined the power of force indexes, pocket pivots, the industry group line, and VPOCs. This is a powerful combination to indicate when either Bulls or Bears have control of a stock, and it gives us a visual of volume and price levels of support and resistance.
What makes this a powerful is that volume at price and VPOC are based upon price and volume, and support and resistance which show true demand and supply rather than some esoteric mathematical indicator. It works for stocks, ETF’s, and indexes, but I think it’s most powerful implementation will be with individual stocks that are assigned to groups. We shall see, but I plan to add these charts to my primary views.
I believe the Bulls are still in control of this market, and the trends all remain up for the NASDAQ. The SP 400 and 600 had a short term pullback, but look bullish to me after Thursday’s intraday reversal. Semiconductors and Utilities remain strong, and Biotech’s are regaining some upward momentum, but are mixed. Precious Metals, Energy and Materials showed strength on Thursday. Steel stocks are on the move again.
OUT STOCK MARKET EARLY MORNING INSIGHTS
Stock Market Early Morning Insights is a product of Ron Brown Investing. The complete report and all the charts are produced daily before the market opens and distributed by email to subscribers. Reports published on the HGSI Blog are delayed and do not contain all the charts. For more information about subscribing use this link. MORE INFO
Comments are closed.