Updates to Volume Price Analysis (VPA)
October 18, 2015 – HGSI Investment Software Upgrade HGSI V8 27278 (replaces build 27274)
Minor upgrade to correct some problems with build 27274
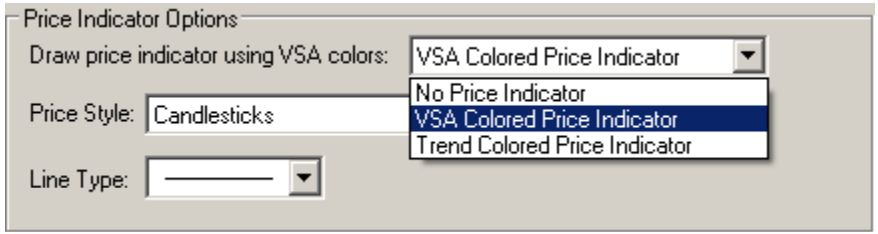
Changed the Volume Price Analysis (VPA) Charting Indicator
When the VPA indicator drew price bars using the optional VSA Colored Price Indicator or Trend Colored Price Indicator and the stock didn’t have at least 120 days of data the indicator wouldn’t draw any price bars at all. If the stock had 121 days we would draw the first 120 days using the foreground color, then start using the VPA colors. But if a stock had less than 120 days of data the chart would be blank. This was most noticeable for IPOs.
Changed the Help section for Volume Price Analysis
The section on Display Options for “Highlight VPA Signal days on Chart” was improved to better explain the conditions required for generating the VPA Signal (vertical bar) and the VPA Shape (images). The explanation now reads:
For the VPA Signal (vertical bar) to be drawn on the HGSI chart the stock needs to have at least 120 records to compute, plus 30 days for standard deviation computation, which is about 24 weeks or about 6 months. If the stock does not meet these requirements the computations result in no VPA/VSA colors and no shapes. IPOs are a good example of not seeing any signals but you will find this situation to be true if you look at the beginning of older stocks, for example Boeing (BA).
Once the record requirements are met, the daily volume must be higher than 100,000 plus have one of many other internal signals to be true. Most of these internal signals will also draw a VPA Shape image on top of the VPA Signal. Shape images can appear on the chart without the VPA Signal (vertical bar) because shapes do not require the 100,000 or more daily volume. Shapes are explained in the HGSI Shape Guide.
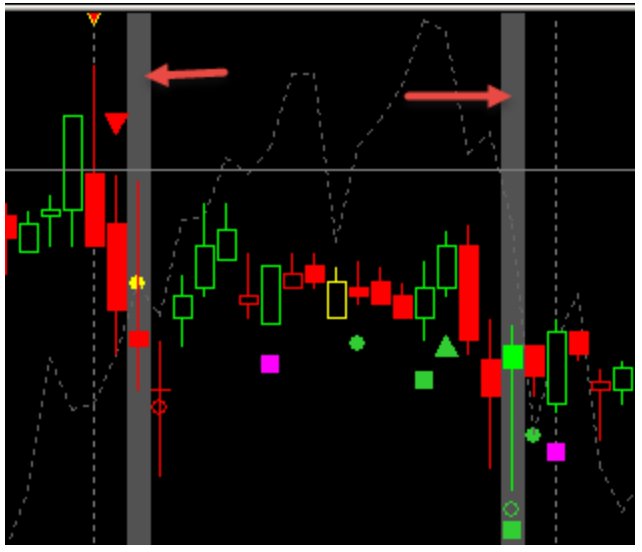
On the chart snippet below you can see two instances of the VPA Signal (red arrows). Those signals also have VPA Shape images that have specific meaning.
You can also see there are times when you have VPA Shape images but without the VPA Signal. The VPA Signal and the VPA Shape icons are two separate systems for generating what you see on the VPA chart indicator.
October 21, 2015 – HGSI Investment Software Upgrade HGSI V8 27282 (replaces build 27278)
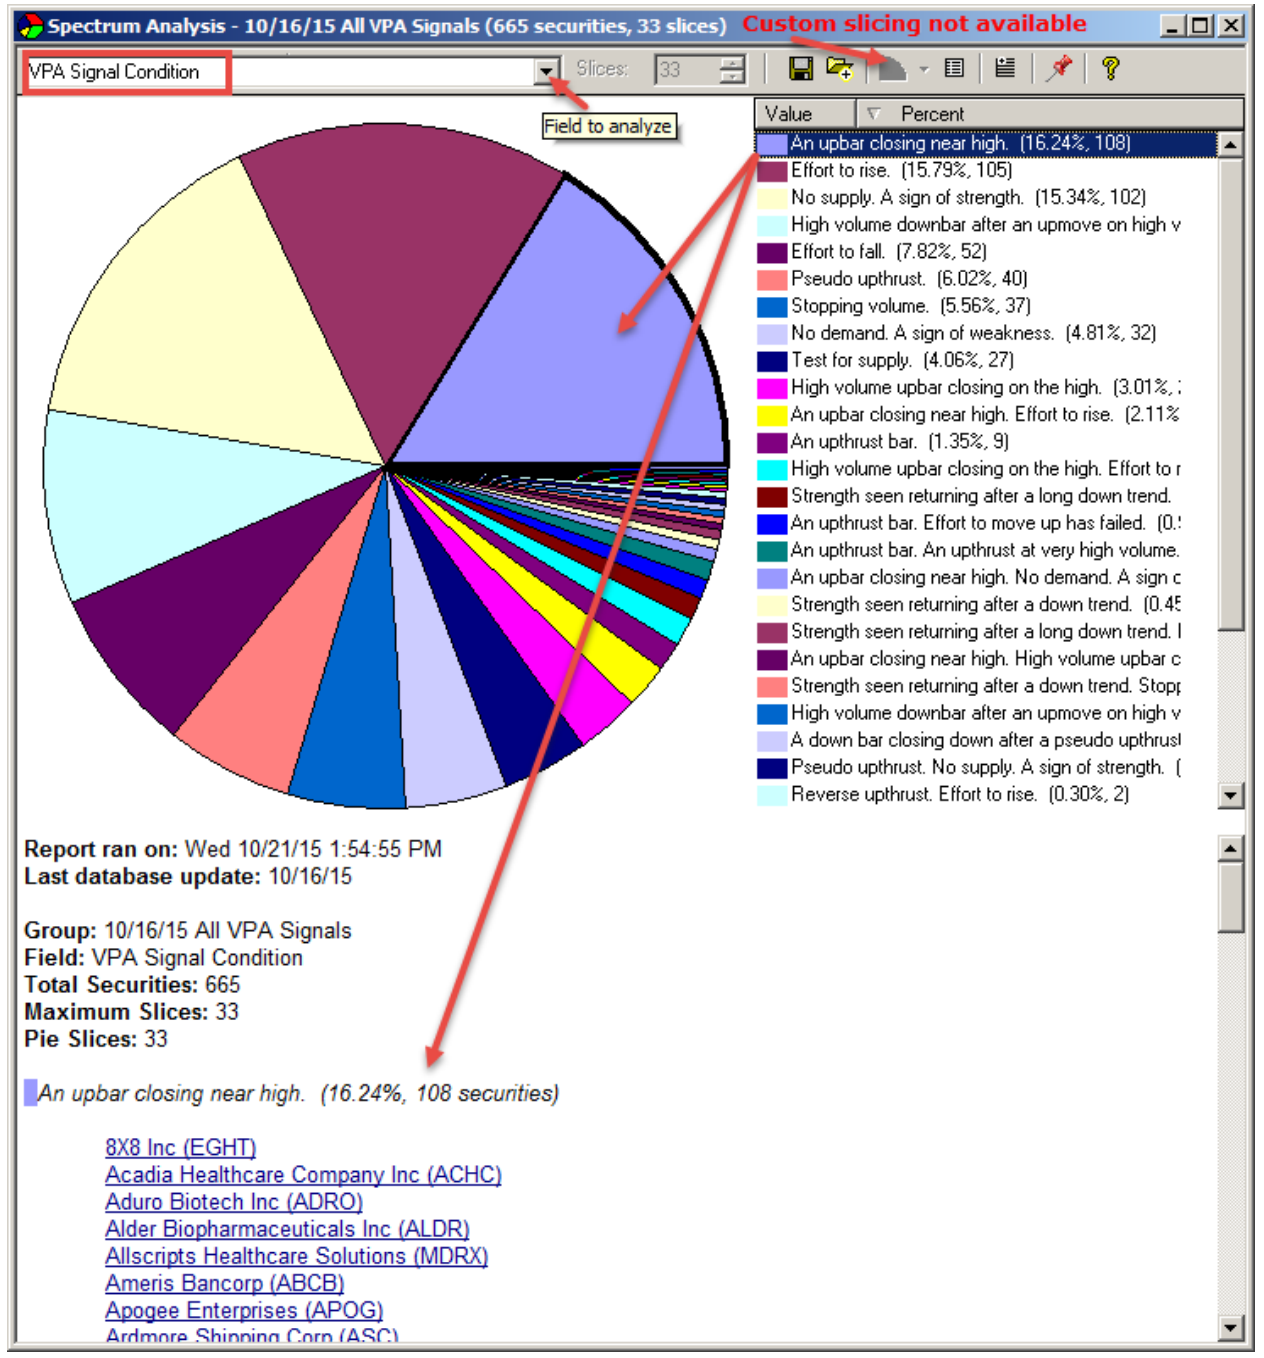
Minor upgrade to correct the Spectrum Analyzer pie slice settings for data fields VPA Description and VPA Signal Condition.
These two fields were incorrectly setup to be custom sliceable and appeared as valid fields for custom pie chart slice settings. The fields are now correctly setup as text fields. If they are selected for custom slices you will get the message:
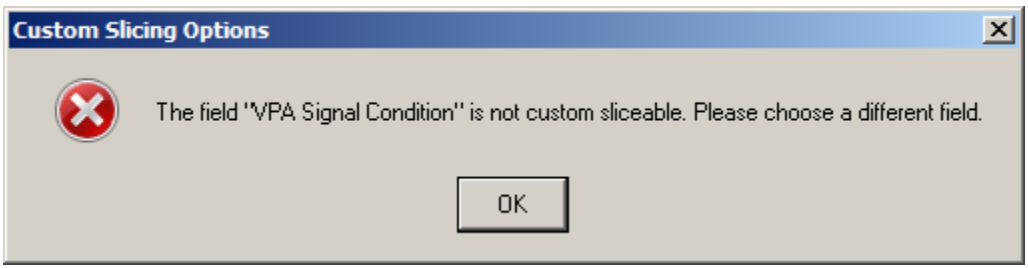
To slice these text fields select the field in the Field to analyze drop down window. Text fields will correctly display the number of occurrences of each VPA Description or VPA Signal Condition. (see image below)
Comments are closed.