HGSI Doc 2020.03.09 – The Longer Term View After the Morning Downturn
Good Afternoon!
The market has opened as ugly as predicted and seems to be trading sideways after a huge Gap down at the open.
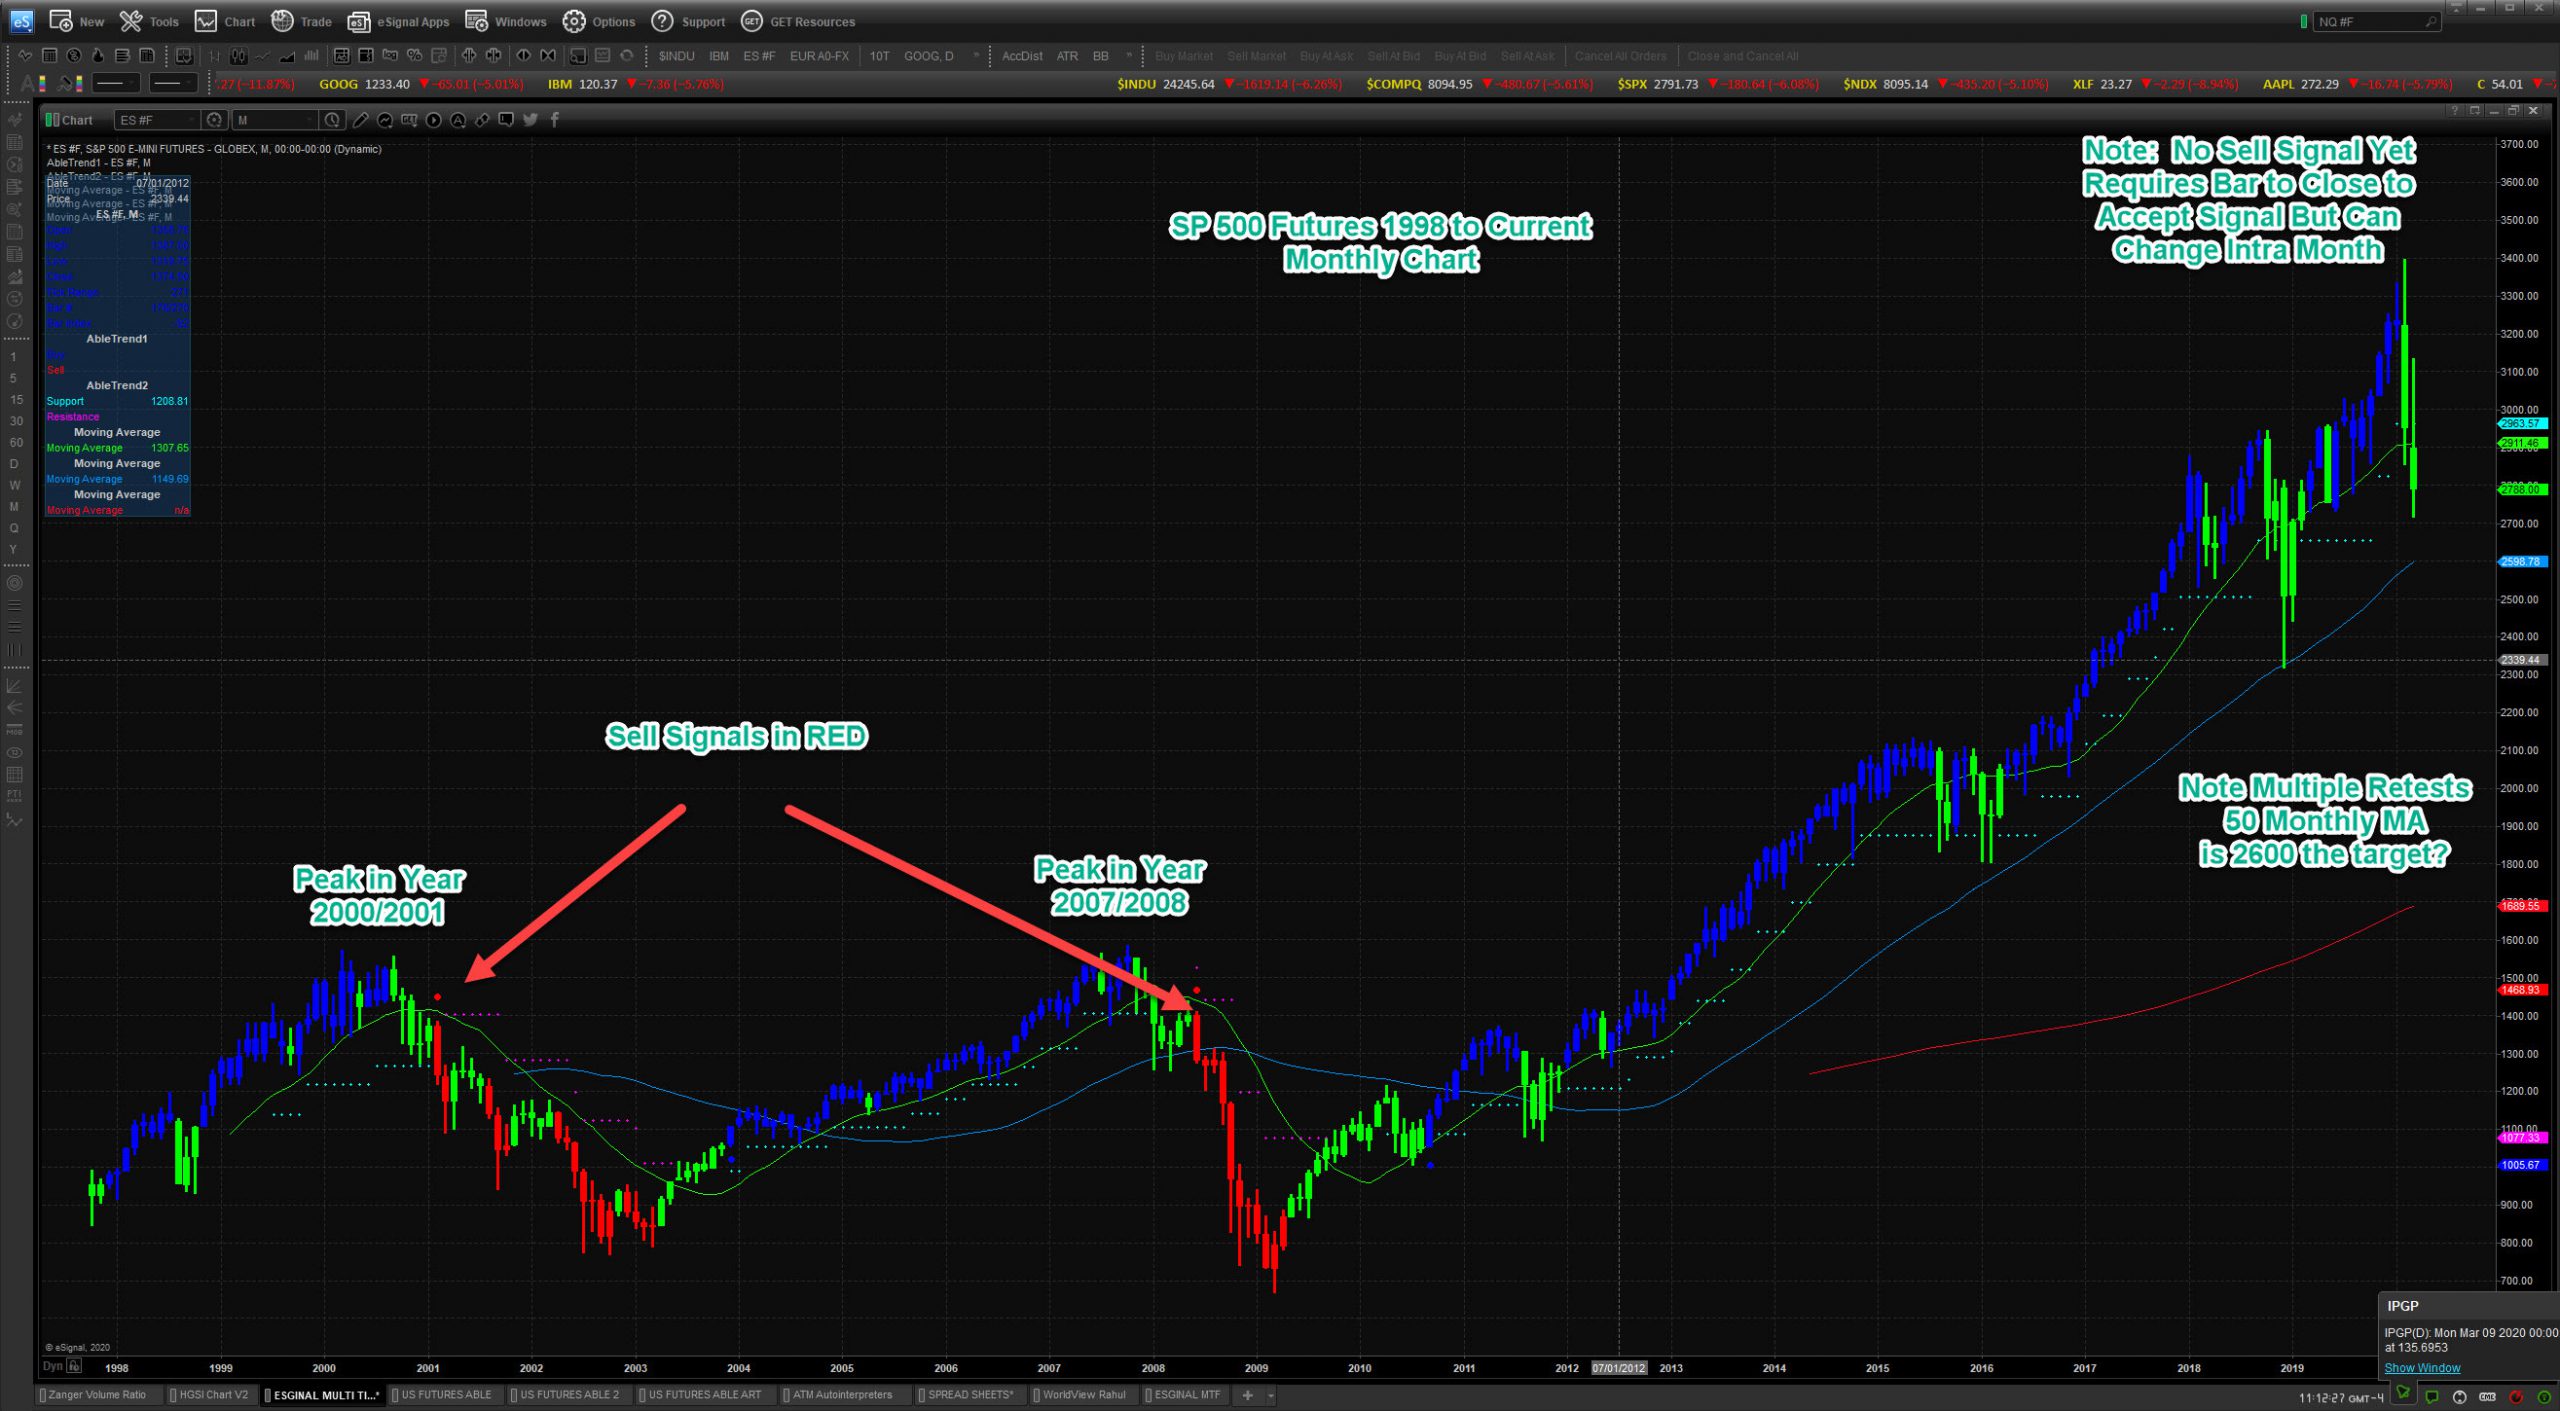
I have attached and marked up a Monthly Chart on SP Futures using ABLESYS indicators on ESignal.
I find it remarkable how we have not seen one red bar since 2009. A green bar is neutral, blue bullish and red bearish. I also note how we have thus far respected the 50 Week Moving average. This has been support before.
Yes, always looking for a silver lining but on this longer term view:
- This pullback is not that abnormal from perspective of long term moving averages
- We do not have the longer term sell signal yet. However we also have 20 more days in the month to trigger the red bar
- A natural line in the sand for support is the 2600 level.
- If we lose 2600, the prior basing around 2100 comes into play.
Regards
Jeffrey
HGSI Doc
My Dropbox
My Approach to Trading and Indicators
My Blog
My YouTube
My Email Contact
HGSI 30 DAY FREE TRIAL SUBSCRIPTION
Dr. Jeffrey Scott is a private investor and educational affiliate for HGSI Investment Software LLC
Comments are closed.