NEW Volume Price Analysis & Charting Annotations
Volume Price Analysis (VPA) Charting Indicator
This indicator is based upon concepts originally popularized by Richard Wyckoff and Jesse Livermore nearly a century ago to read the tape to determine what the “smart money” was doing.
Tom Williams of TradeGuider was the first to computerize the indicators which he refers to as VSA, Volume Spread Analysis. Both VPA and VSA use the same concepts.
Others have followed Tom William’s lead, and there are other software programs out there using VPA/VSA.
The HGSI version is based upon the work of Karthik Marar who generously coded VPA for AmiBroker, and placed his code in the public domain several years ago.
What sets the HGSI version apart from any other version of VPA is the ability to analyze markets, sectors, groups, stocks and ETFs from the top down. No other software program gives this kind of insight.
The best current explanation of the concepts behind VPA are by Anna Coulling in her book, A Complete Guide to Volume Price Analysis.
This video introduction to VPA, Volume Price Analysis by Ron Brown
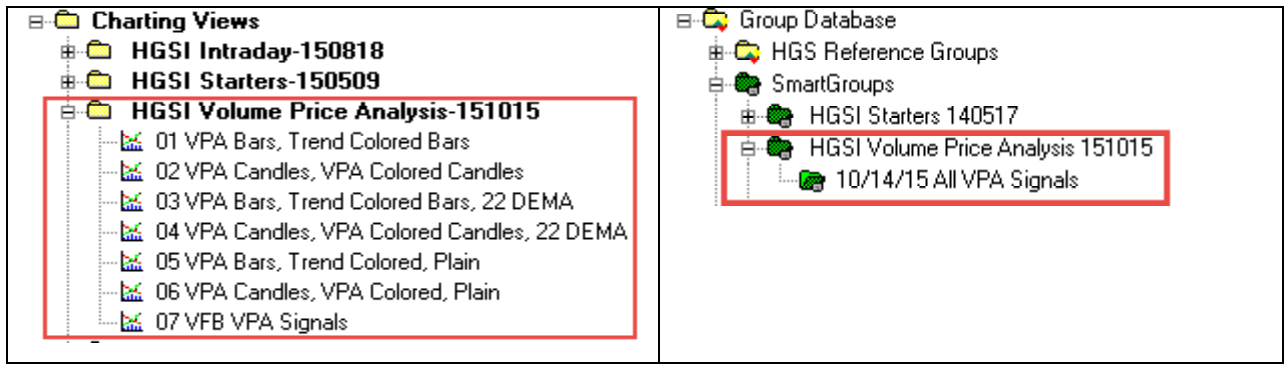
Two new Add-ons for use with VPA.
If you are updating an existing installation you will need
to go to Help and select Add-on. Select the Add-ons for HGSI Volume Price Analysis. If you are
installing a new copy of HGSI you do not need to do the Add-on. All the files are in included
with a new copy installation.
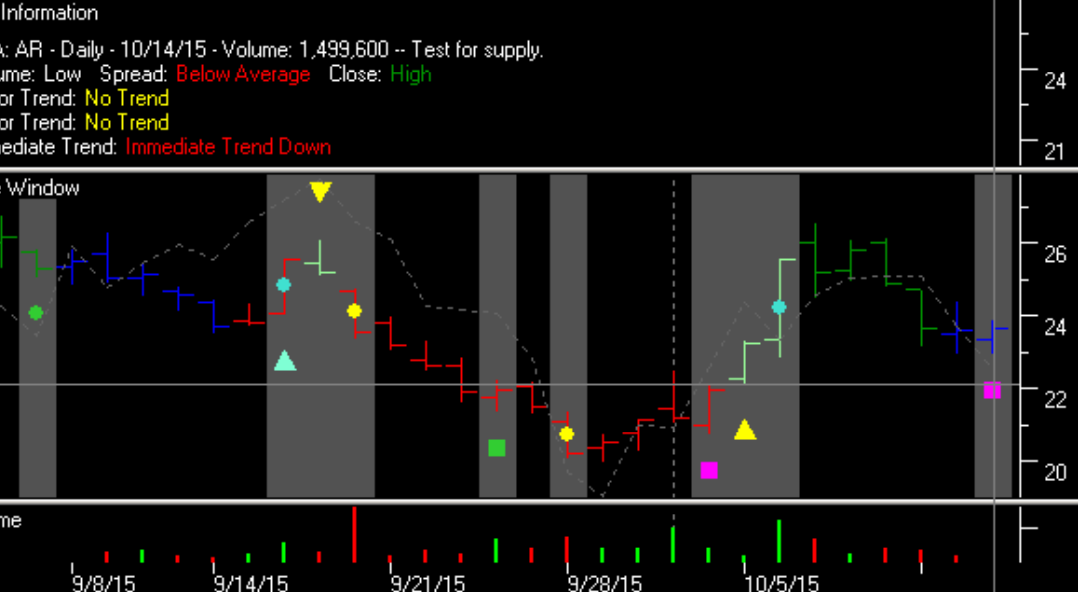
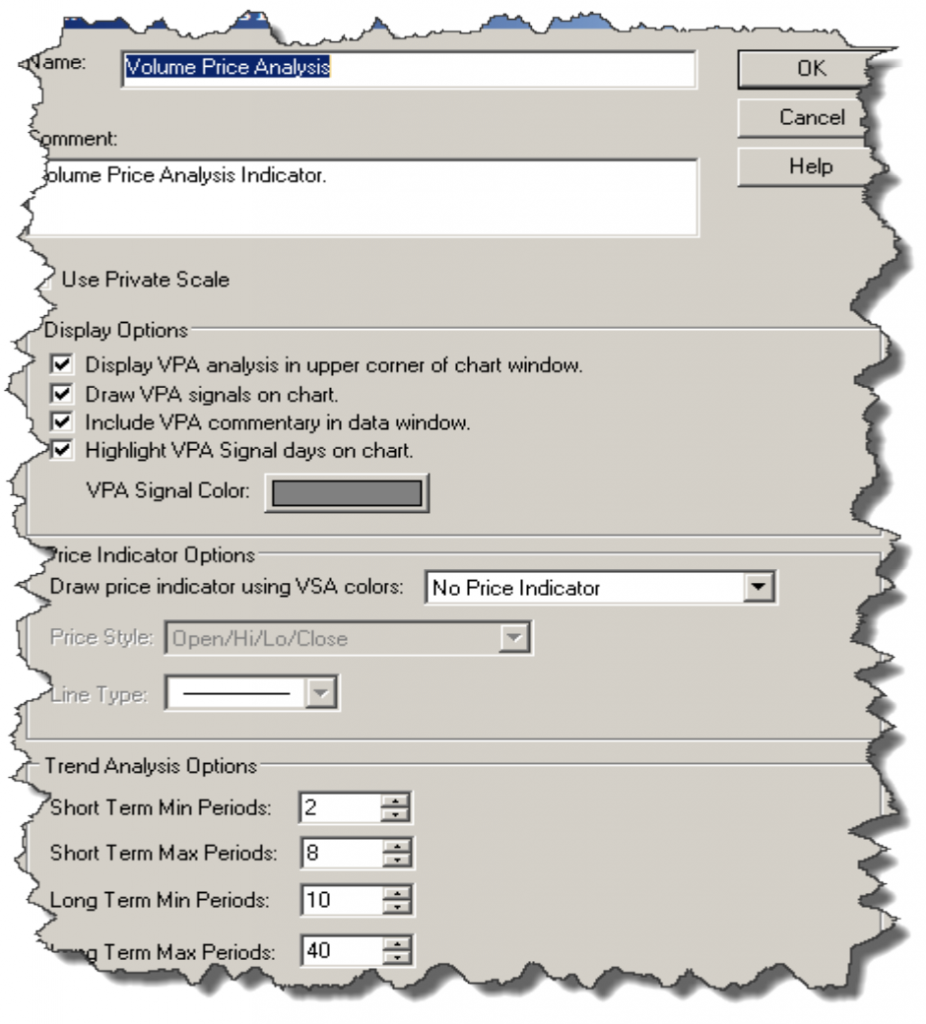
The VPA Charting Indicator options and signal interpretations are significant. Please refer to the HGSI Help and search for Volume Price Analysis.
Indicator Reports enabled for the VPA indicator!
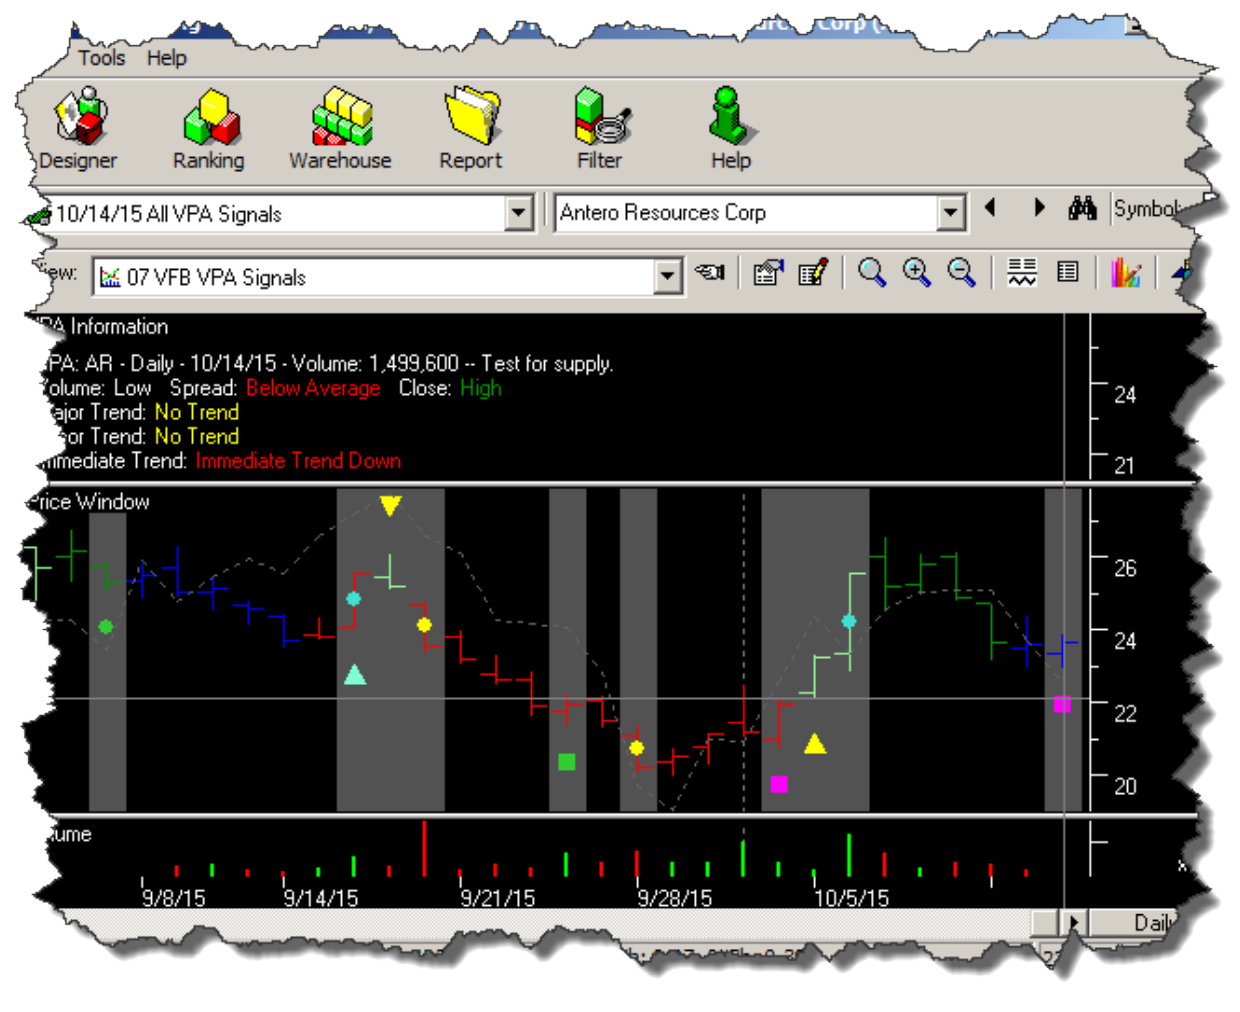
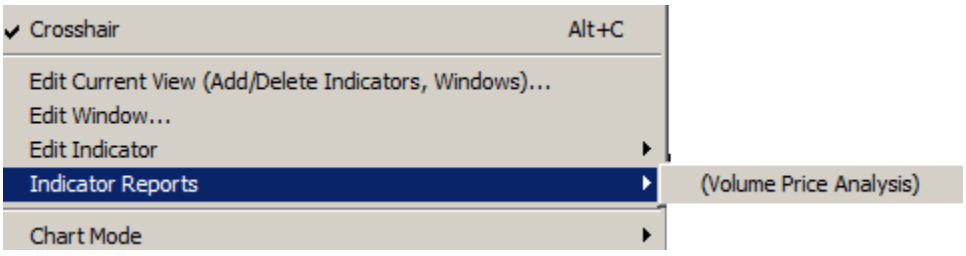
Some HGSI Charting Indicators can produce a report specific to the indicator. Do a right mouse click on the chart window with the VPA indicator and select “Indicator Reports” (Volume Price Analysis).
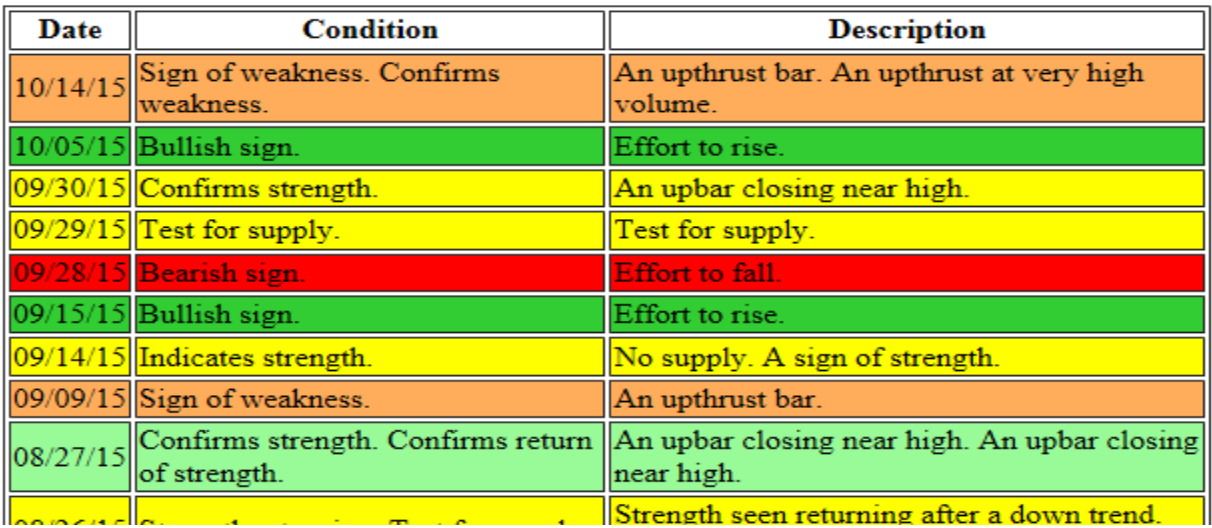
A Save As Window will open to save a HTML report. The report will show all the signals as far back as the available data. The example of the Boeing report below goes back to 1990.
Volume Price Analysis Indicator Data Report
Security: Boeing Company (BA)
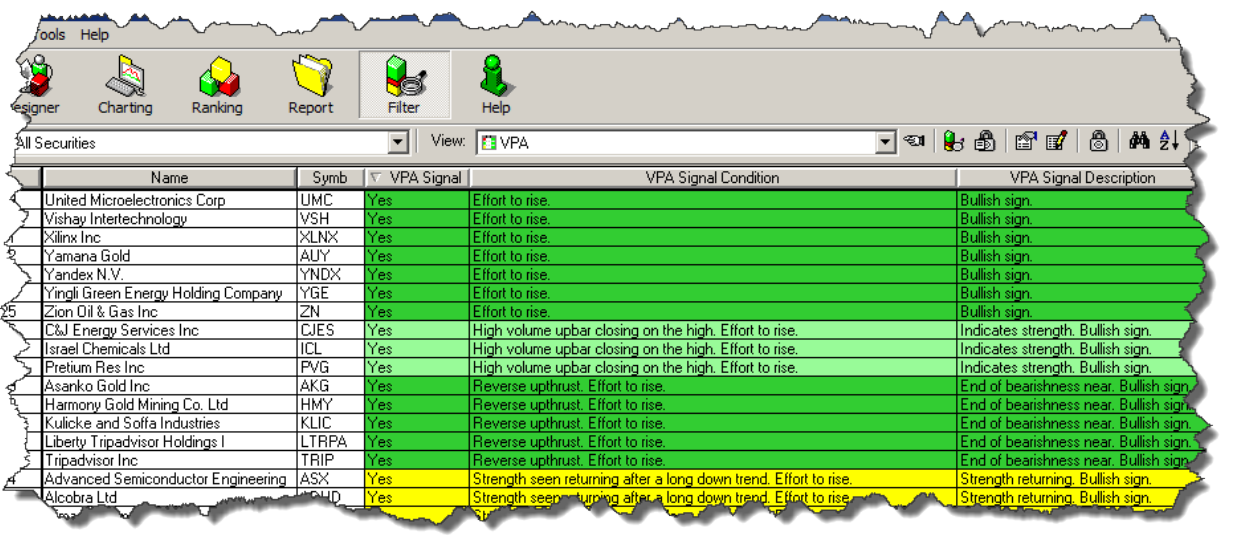
Three new Warehouse data fields and filters have been added to do VPA prospecting:
- VPA Signal
- VPA Signal Condition
- VPA Signal Signal Description
Charting Annotations Improvements
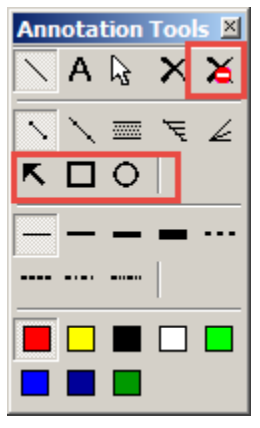
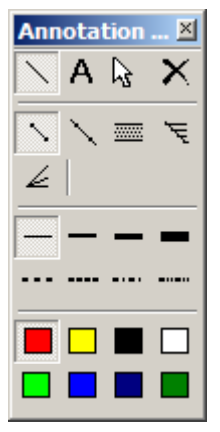
- 5 buttons wide vs older 4 buttons
- New Delete All button (Alt E on keyboard)
- Three new line modes (arrow, box and a circle). Boxes and circles are lines you drag out the start and end points to draw. The arrowhead is sized based on the length of the line and the pen size selected.
- In select mode you can now move annotations. If you click and drag on the ends you can reposition that part of the annotation. If you click in the middle (or in the case of text inside the text box) you can drag the whole text box around.
- In select mode when you pick an annotation (text or line) the annotation toolbar will update to show the line style, pen size and color. If you change them it will change the annotation. This is how you change the color of a line or text. You can also change the type of line. Just select the item and pick a new color or line type. Changing the line type on a text annotation has no effect.
- If you double click on a text annotation it will bring up the text annotation box so you can change the text.
- When creating or editing a line the shift key will lock the line into horizontal mode or a vertical mode, depending on the location of the mouse. If the angle between the mouse and the starting point is higher than 45 degrees it switches to a vertical line, otherwise its locked on the horizontal.
- If you hold down the shift key when activating the annotation toolbar (either by pressing the button on the mini toolbar or by hold shift and pressing ALT+A) it will summon the annotation toolbar to the location of the mouse. The tooltip on the annotation toolbar for the line has changed from “Draw Lines” to just “Draw”.
- When drawing an annotation if you click the right mouse button it will abort the annotation. When editing an annotation if you click the right mouse button it will delete the annotation.
- We now correctly set the font for text annotations. Before the font dialog would come up but not have anything selected. We are using MS Sans Serf 8 for the default font.
Comments are closed.