HGSI Investment Software – Product Release 25849
Note To Current Users of HGSI: This release contains updates to the Volume and Percent Change charting indicators in your User Chart Views. The new format is not backward compatible to earlier releases of the HGSI software. This means you cannot send chart views containing a Volume Indicator or Percent Change Indicator made using this release to others unless they are also using release 25849. These changes DO NOT affect the results of how these indicators have been working.
MAIN FEATURE “Moving Average Percent Change”
Introducing another unique group comparative analysis tool from HGSI Investment Software! We call it “Moving Average Percent Change” or (MAPC). The moving averages can be the price/volume from stocks/ETFs/market indexes/HGSI groups indexes. All you do is select the symbols, values, moving average time periods and style of graph. The indicator computes the percent change and graphs it on the chart.
For example, using HGSI intraday 15 minute delayed updates you can graph the current day HGSI Estimated EOD volume vs the 50 day moving average volume. On our intraday chart you will get visual as well as numerical value insight to how the stock/ETF may close. The estimated EOD close above the 50 DMA volume throughout the day might be an opportunity for early entry or the inverse may be a signal for exit.
For a more powerful example, use MAPC to create HGSI “Dashboard Chart Views”. In HGSI a Chart View can have multiple windows with each window displaying a MAPC indicator containing different option settings. One of those settings lets you pick specific symbols to use for each of the two moving averages. With this versatility you can setup a Chart View as a “dashboard” by comparing, for example, two different currency symbols or two different commodity symbols or market index symbols. When you do a percent change between two different securities you are using the MAPC primarily as a spread indicator to show the direction/trend/pattern of the graph.
IDEAS FOR YOUR IMAGINATION
Create a Currency Dashboard. In a chart window set one of the two MAPC moving averages to use the alternative security option for the US dollar symbol (UUP) and the other moving average the Euro symbol (FXE). Setup several other windows in that same dashboard view with other currency symbols to expand the currency dashboard to meet your needs. Want more? Create dashboards for commodities, market Indexes, stock/ETF symbols. Try a Volatility Dashboard with volatility indexes e.g. $VIX vs $VXV (S&P 500 3M VIX).
Using the MAPC Alternative Security Option you are only limited by your imagination of picking two symbols that have some relationship between them and comparing their differences as a Moving Average Percent Change over time.
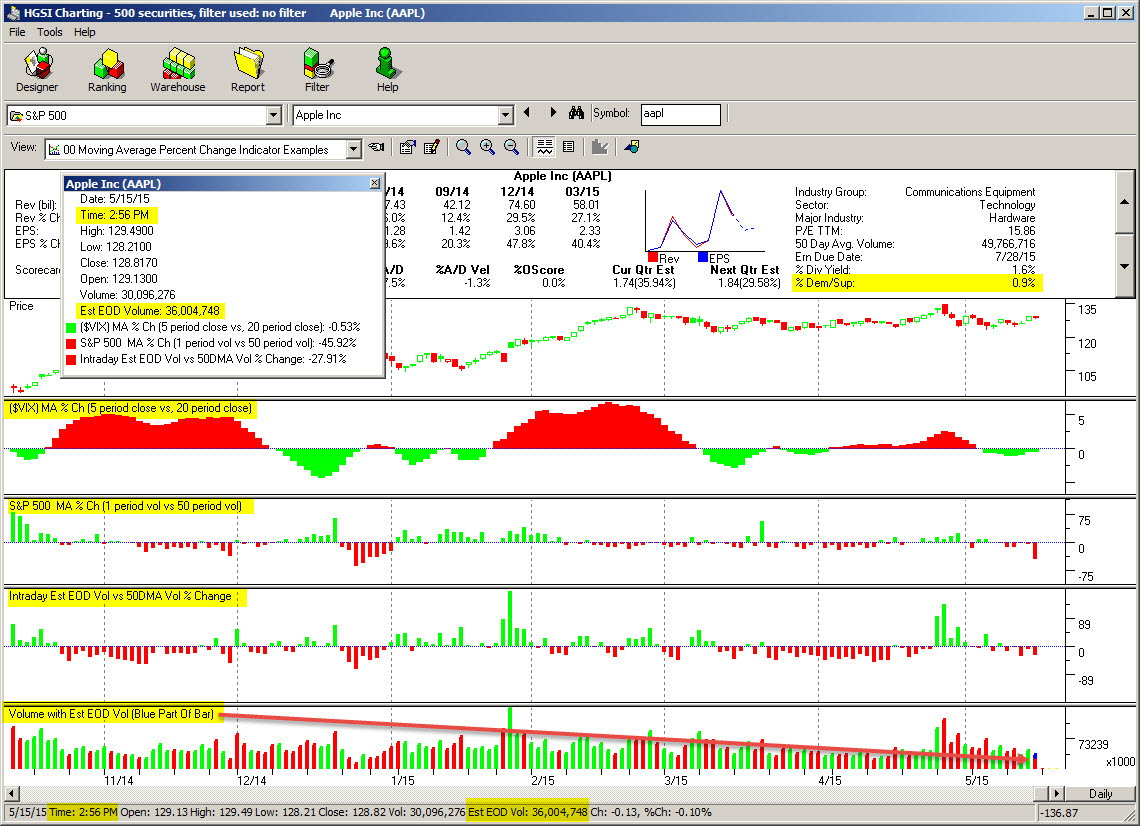
Click the image to enlarge and see some random examples of the MAPC indicator. Yellow highlighting indicates all the charting changes made for this release.
MAPC INDICATOR OPTIONS – LOOKING UNDER THE COVER
If you are not a HGSI user, yet, you might want to skip over the details for the indicator settings but if you are curious read on! Or you might just want to take advantage of our 30 Day Free Trial!
HGSI users there is a lot more in this release so you should read on!
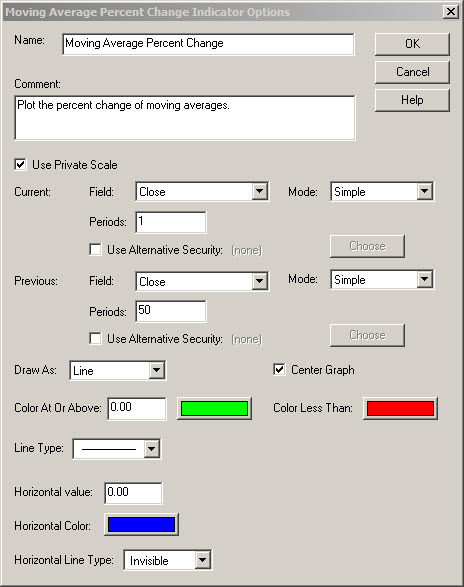
To compute a percentage change you need to compare two values, this indicator allows you to pick which field to use for each for those two values. You do not need to use the same field for both parts, so for example you could compare the close with the high.
Field: The stock data field to use
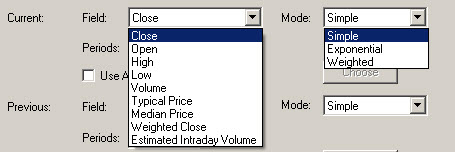
NOTE: Typical Price is also known as a Pivot Point. (do not confuse with Pocket Pivots)
These are the same fields available in the Moving Average Indicator, with the addition of Estimated Intraday Volume. The Estimated Intraday Volume replaces the last stock volume with an estimated on what it would be at the end of the day (based on the time the intraday value was sampled). This will only be different from the normal volume if intraday data is enabled in the charting and the stock’s Intraday data has been updated and the market hasn’t closed.
Mode: Is the standard Moving Average modes of Simple, Exponential and Weighted
Periods: is the number of periods to include in the moving average. Use of 1 for period will cause the field to be the actual value. So a 1 period simple moving average of Close is just the Close. This can be used to compare the most recent version of a field to a moving average of that field.
Use Alternative Security: This option allows you to setup this indicator to use a fixed stock symbol or index for this indicator. This enables you to compare a moving average of the current security to, for example, a moving average of the S&P 500. Or it allows you to display a line/graph based on a specific stock no matter what security is selected in the charting. To enable this mode, check the box and pick the security using the Choose Index/Security dialog opened using the Choose button.
Examples:
- 10 DMA $VIX vs 100 DMA $VIX
- Volume on S&P 500 vs 50 DMA on S&P 500
Draw as: Specifies how to draw the percent change, options are:
The Line and Histogram modes use the brush selected with the color, the Filled Histogram mode, new for this indicator only uses the color.
Color at or above: This value is used to choose between the two colors. When the percent change is greater than or equal to the value in this box the first color will be used to color the indicator. If it is less than this value, the “Color less than” color will be used to draw the line segment or histogram.
Line Type: Is the standard HGSI line type choice and only applies when using the Line or Histogram modes.
Horizontal value/color/Line Type: Allows you to specify a value for a horizontal line added to the indicator. This can be made invisible.
In most cases the histogram and filled histogram modes will be easier to see patterns and trends.
Here are a variety of examples you can use to get started:
- Percent change of the Close vs the 50 DMA Close can be created by using a Current Field of Close with a 1 period simple mode. The Previous should be set to close with a 50 period simple moving average. These are the default settings for the indicator.
- Percent change of the volume vs the 50 DMA volume can be created the same way by changing the Field to Volume. You can also use the Estimated Intraday Volume so that the chart is more predictive before the end of the day.
- Pivot Point vs the 50 DMA Pivot Point
- Pivot Point vs the 50 DMA of the High
- 10 DMA close vs the 50 DMA Close
New Charting Volume Indicator Option:
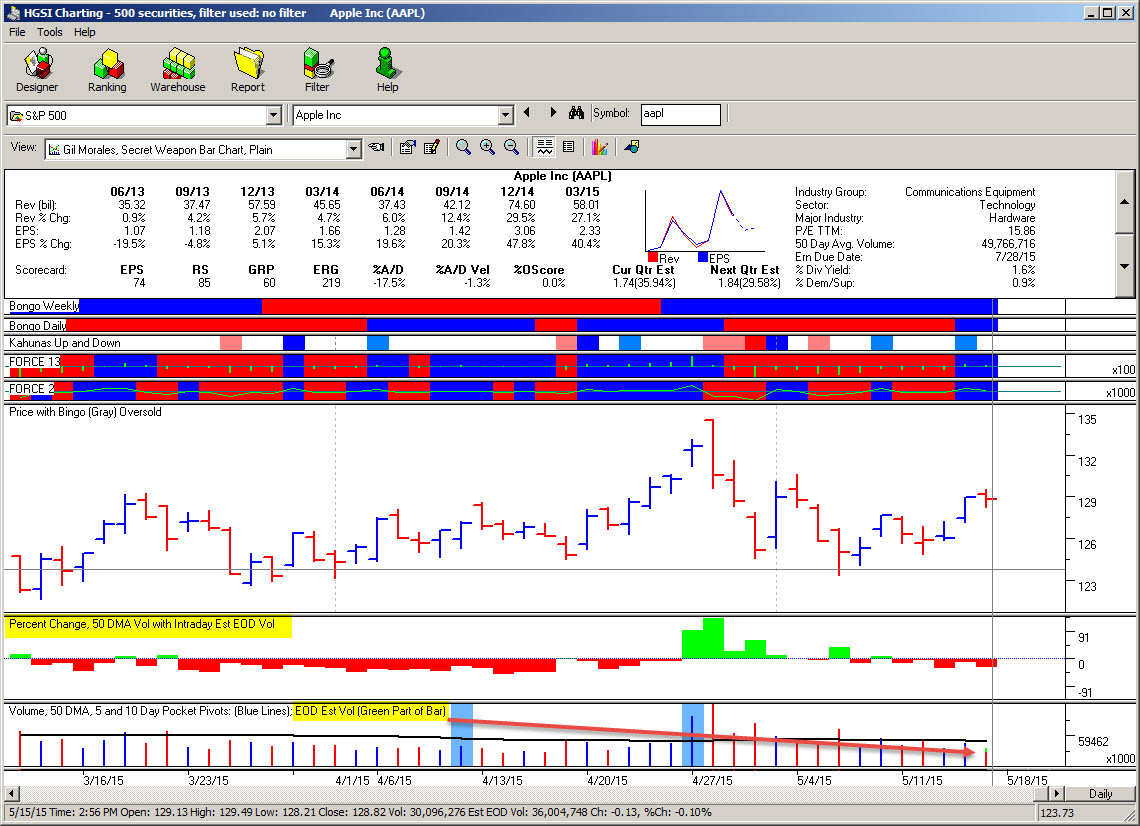
Look for a new check box to display Intraday Estimated EOD Volume on top of the Intraday Volume bar as a separate color.
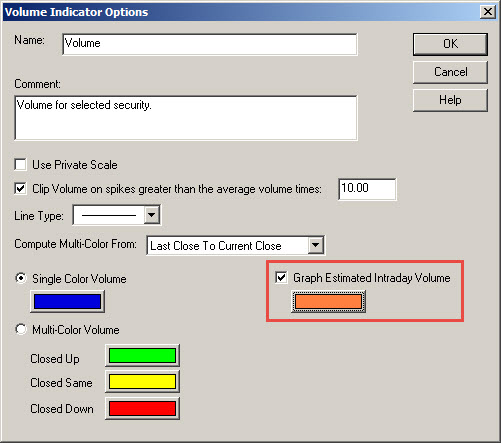
When the “Graph Estimated Intraday Volume” box is checked the volume bar will display a different color for the estimate. The volume up to that point in the day will be drawn using the standard color (or colors if you are using the multi-color mode). The estimate (which is always higher) will be drawn on top in the Graph Estimated Intraday color. NOTE: Early in the morning the estimated volume will be so small that you can’t really see it, but as the day goes on the volume bar will become more and more the normal color and less the estimate.
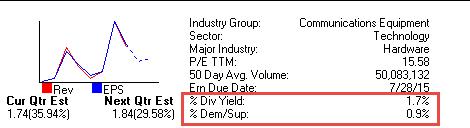
Charting Fundamental Panel:
Added “% Dem/Sup” to Charting Fundamental Panel and changed label for “Div Yield” to “% Div Yield” to match Warehouse column.
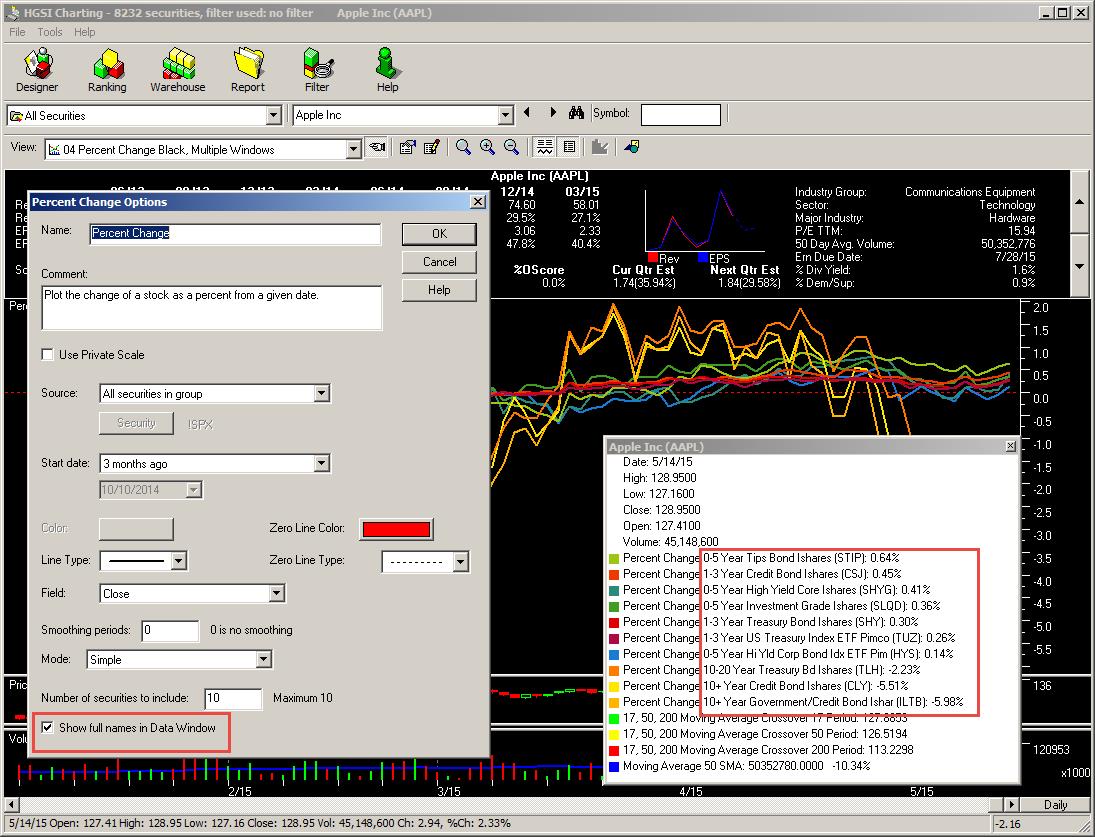
Percent Change Indicator:
Added a check box to “Show full names in Data Window”
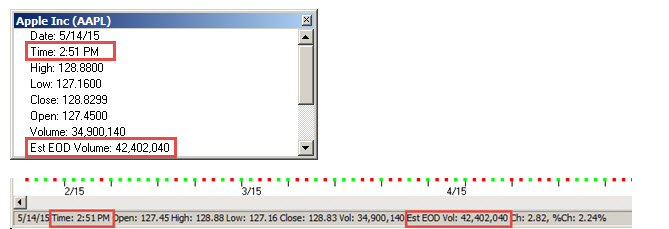
Data Window and Status Bar:
Added the intraday time and estimated volume to the status bar and the charting data window. In the charting status bar it reads “Est EOD Vol” in the Data window it reads “Est EOD Volume”. Time is the same as the warehouse column.
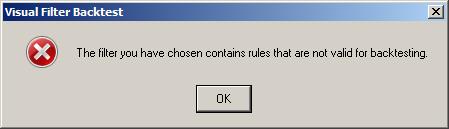
Visual Filter Backtest Indicator:
Intraday data fields are not back testable. If used in a Visual Filter Backtest filter a warning message will now be displayed.
Intraday Chart Updating With Filter:
The chart group list is now automatically reevaluated by the filter if it contains intraday fields such as Intraday % Vol/50 DMA Vol > 20% . Prior to this improvement the group list was not automatically reevaluated unless you opened and closed the charting window.
Rate Of Change Charting Indicator:
The indicator now uses HGSI SmartPercent so it can handle changes from 0. The indicator also now defaults to not being included in the windows scale when added to a view
WAREHOUSE/FILTER FIELDS:
- NEW: Days Since 10DMA Crossed 20DMA
- NEW: Days Dn Since 10DMA Crossed 20DMA
- NEW: Float Turnover (float divided by the 50 day moving average volume)
- NEW: % Vol/50 DMA Vol fields now color coded Green ( >0), Yellow (=0) , Red (<0)
- NEW: % Vol/20 DMA Vol fields now color coded Green ( >0), Yellow (=0) , Red (<0)
RELIABILITY/USABILITY FIXES:
- Adjusted the Warehouse default column width on the Intraday %Vol/50 DMA Vol and the Intraday Pr Ch 1-Dy so they better fit the column width
- Group database now written to disk after doing a Designer Group Inclusion Report (GIR)
- A forced windows shutdown caused by Windows or initiated by the HGSI user while HGSI still has one of the HGSI windows open can result in lost user groups. HGSI now attempts to intercept Windows from shutting down until HGSI has shut down
- Exporting a HGSI group with a name containing an extra space character at the end of the name didn’t export properly. HGSI now detects that condition and alters the name into _GROUPNAME_ so the folder can be correctly created on disk
- Fixed crash problem resulting from bad split data in the database
Comments are closed.