Stock Market Early Morning Insights – July 13, 2016
Stock Market Early Morning Insights – July 13, 2016
Thank you to those who have signed up for my webinars. I am going to teach you more about getting the most out of HGSI than you may want to know, but you will truly appreciate the power of the software as you learn more about it. If you have interest contact me at ron@highgrowthstock.com. These webinars will start within the next two weeks of July 2016.
Yesterday was another gap opening day for the NASDAQ composite, the S&P 400, and the S&P 600. The multiple gap days suggest short covering along with institutional buying. Volume is still running below average for the S&P 400 and the S&P 600, and was average for the NASDAQ composite.
The Semiconductor Devices stocks continue to be one of the most in demand groups which illustrates how this market has gone from fear to greed since the Brexit referendum. As you all know by now, the S&P 500 and the Dow Jones 30 establish new record highs yesterday,partially thanks to a strong turnaround in oil and energy related stocks.
The best snapshots of where the strength and weakness is in the markets is always in these views: the spectrum analyzer view in stocks and groups moving to the upside and the downside, and the industry groups sorted on the raw combo, which is the Demand Combo.
The top 50 GIR shows strong stocks and groups. This morning it is dominated by energy stocks, Semiconductor Devices, and Application Software. The Stocks and Groups Moving to the Upside SmartGroups agree, but also show that Airlines are on the move with 8% of the top 100 stocks belonging to the airlines group. If you scroll down to the industry group listing you will see that the most in demand group is the Airlines index, followed by the Semiconductor Devices, Steel Raw Material Suppliers, Application Software, Base Metals, and Internet Media.
The Airlines index remains in a VPA long-term downtrend, but the medium and short term trends are up. The last VPA flag for the group was generated nine days ago after the smart money started accumulating the airline group. This chart shows back to back stopping volume days, a no supply day, and a bar closing near the high which confirmed the return of strength. It’s tough to take these trades, but the flags were there. VPA flags do not work all of the time, but they certainly give us insight into potential trades if we look for them. The airline group is a perfect example.
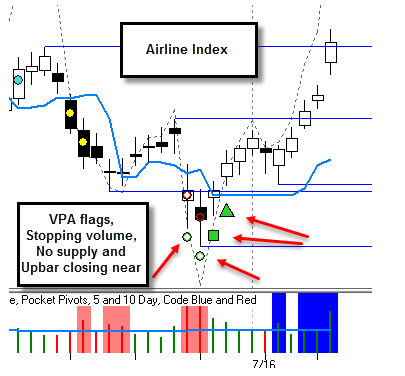
Now, many of the airline stocks are overbought from their lows, but if they back and fill in test for supply, this could be the beginning of a much longer moved to the upside. Only one airline stock has made the top 50 GIR so far, and that is Hawaiian Holdings, which is a Box 1 stock. If the strength continues for the group, we will see more airlines appearing in the top 50.
Stock index futures are slightly positive today, but stocks are extremely overbought in the short term. If you scroll down to the last two images below, you will see that nearly 40% of the industry groups are trading above their upper Bollinger bands, and 93% of the S&P 1500 are trading above their middle Bollinger bands. This market needs to, as Ian would say, ”Pause to Refresh”.
All trends remain up, but extended stocks all are vulnerable for profit-taking. The risk/reward is not favorable for stocks that have moved too far too fast. One thing to consider is the fact that Amazon, the clear leader in the stock market saw some profit-taking yesterday.
STOCK MARKET EARLY MORNING INSIGHTS
Stock Market Early Morning Insights is a product of Ron Brown Investing. The complete report and all the charts are produced daily before the market opens and distributed by email to subscribers. Reports published on the HGSI Blog are delayed and do not contain all the charts. For more information about subscribing use this link. MORE INFO
Comments are closed.